
Page 687 - Demo
P. 687
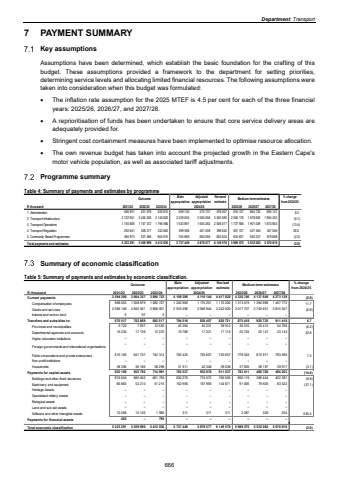
Department: Transport 7 PAYMENT SUMMARY Key assumptions Assumptions have been determined, which establish the basic foundation for the crafting of this budget. These assumptions provided a framework to the department for setting priorities, determining service levels and allocating limited financial resources. The following assumptions were taken into consideration when this budget was formulated: %uf0b7 The inflation rate assumption for the 2025 MTEF is 4.5 per cent for each of the three financial years: 2025/26, 2026/27, and 2027/28. %uf0b7 A reprioritisation of funds has been undertaken to ensure that core service delivery areas are adequately provided for. %uf0b7 Stringent cost containment measures have been implemented to optimise resource allocation. %uf0b7 The own revenue budget has taken into account the projected growth in the Eastern Cape's motor vehicle population, as well as associated tariff adjustments. Programme summary Table 4: Summary of payments and estimates by programme Outcome Main appropriationAdjusted appropriationRevised estimate Medium-term estimates % change from 2024/25R thousand 2021/22 2022/23 2023/24 2025/26 2026/27 2027/281. Administration 531 578 530 815 466 921 559 740 578 307 575 737 616 127 664 730 695 141 6.52. Transport Infrastructure 2 122 951 2 435 246 2 146 820 2 439 635 2 503 590 2 583 056 2 500 176 1 878 602 1 964 352 (0.1)3. Transport Operations 1 755 806 1 747 372 1 796 586 1 633 897 2 006 017 1 655 282 1 737 908 1 901 049 1 874 663 (13.4)4. Transport Regulation 308 217 332 840 292 641 399 508 398 040 401 408 501 727 437 364 457 046 26.05. Community Based Programmes 537 586 604 975 584 973 704 669 663 624 664 094 633 637 650 337 679 608 (4.5)Total payments and estimates 5 223 291 5 559 999 5 412 036 5 737 449 6 149 578 5 879 577 5 989 575 5 532 082 5 670 810 (2.6)2024/25Summary of economic classification Table 5: Summary of payments and estimates by economic classification. Outcome Main appropriationAdjusted appropriationRevised estimate Medium-term estimates % change from 2024/25R thousand 2021/22 2022/23 2023/24 2025/26 2026/27 2027/28Current payments 3 594 206 3 904 337 3 890 733 4 159 396 4 417 820 4 330 746 4 137 649 4 273 129 4 116 144 (2.0)Compensation of employees 1 058 879 998 053 1 082 727 1 242 900 1 175 200 1 313 019 1 394 998 1 457 772 1 175 201 11.7Goods and services 2 596 148 2 845 361 2 808 001 2 916 496 3 242 620 3 017 727 2 742 651 2 815 357 2 940 944 (6.9)Interest and rent on land 97 5 5 %u2013 %u2013 %u2013 %u2013 %u2013 %u2013Transfers and subsidies to: 702 869 805 517 676 517 794 516 820 721 830 457 875 418 925 725 911 418 6.7Provinces and municipalities 7 837 12 535 5 722 40 394 38 910 36 516 52 410 45 231 54 768 (6.2)Departmental agencies and accounts 17 129 12 370 16 234 19 786 17 116 22 724 22 147 17 221 23 143 32.8Higher education institutions %u2013 %u2013 %u2013 %u2013 %u2013 %u2013 %u2013 %u2013 %u2013 Foreign governments and international organisations %u2013 %u2013 %u2013 %u2013 %u2013 %u2013 %u2013 %u2013 %u2013Public corporations and private enterprises 641 737 742 314 616 165 702 425 725 657 725 657 778 343 812 971 793 590 7.3Non-profit institutions %u2013 %u2013 %u2013 %u2013 %u2013 %u2013 %u2013 %u2013 %u2013Households 36 166 38 298 38 396 31 911 39 038 37 835 38 197 42 348 39 917 (3.1)Payments for capital assets 952 792 714 991 952 106 783 537 911 037 932 976 783 411 468 708 486 263 (14.0)Buildings and other fixed structures 885 462 661 793 874 654 630 270 766 055 774 672 690 119 388 444 402 387 (9.9)Machinery and equipment 52 210 51 216 66 883 152 956 144 671 157 993 91 005 79 925 83 522 (37.1)Heritage Assets %u2013 %u2013 %u2013 %u2013 %u2013 %u2013 %u2013 %u2013 %u2013Specialised military assets %u2013 %u2013 %u2013 %u2013 %u2013 %u2013 %u2013 %u2013 %u2013Biological assets %u2013 %u2013 %u2013 %u2013 %u2013 %u2013 %u2013 %u2013 %u2013Land and sub-soil assets %u2013 %u2013 %u2013 %u2013 %u2013 %u2013 %u2013 %u2013 %u2013Software and other intangible assets 15 120 10 568 1 982 311 311 2 287 311 339 354 635.4Payments for financial assets 463 %u2013 795 %u2013 %u2013 %u2013 %u2013 %u2013 %u2013Total economic classification 5 223 291 5 559 999 5 412 036 5 737 449 6 149 578 5 989 575 5 532 082 5 670 810 5 879 577 (2.6)2024/25666
