
Page 121 - Demo
P. 121
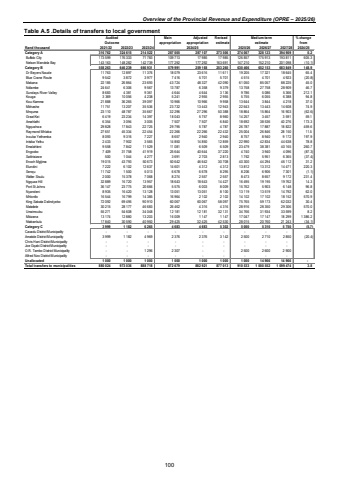
Overview of the Provincial Revenue and Expenditure (OPRE %u2013 2025/26)Table A.5 .Details of transfers to local government Main Adjusted Revised appropriation appropriation estimateRand thousand 2021/22 2022/23 2023/24 2025/26 2026/27 2027/28 2024/25Category A 316 762 324 615 214 522 287 005 287 107 273 506 274 067 328 123 394 909 0.2 Buffalo City 173 599 176 333 71 783 109 713 17 985 126 857 17 985 175 913 193 811 605.3 Nelson Mandela Bay 143 163 148 282 142 739 177 292 177 292 163 691 147 210 152 210 201 098 (10.1)Category B 558 263 646 239 666 931 579 991 259 168 253 260 630 466 652 153 683 849 148.9 Dr Beyers Naude 11 763 12 897 11 376 18 079 23 616 11 611 19 205 17 321 18 645 65.4 Blue Crane Route 9 542 3 872 3 977 7 416 5 701 5 701 4 515 4 701 4 923 (20.8) Makana 22 185 26 864 23 693 43 724 48 327 42 090 61 050 85 057 88 225 45.0 Ndlambe 24 641 6 306 9 567 13 787 6 358 13 758 9 379 27 758 28 909 46.7 Sundays River Valley 8 683 4 381 9 361 4 644 4 644 3 136 9 786 5 086 5 366 212.1 Kouga 10 056 3 369 4 238 5 241 2 955 2 955 5 755 6 055 6 388 94.8 Kou-Kamma 21 888 36 265 39 097 10 966 10 966 13 644 9 958 3 844 4 218 37.0 Mbhashe 11 751 13 207 35 536 23 732 13 443 12 943 22 643 13 443 14 608 74.9 Mnquma 23 110 48 787 35 667 32 296 27 296 50 388 18 864 15 864 16 903 (62.6) Great Kei 23 234 6 419 14 397 18 043 5 757 14 257 8 960 3 457 3 591 59.1 Amahlathi 6 354 3 094 3 005 7 507 7 507 18 692 6 840 38 536 40 276 173.3 Ngqushwa 29 828 17 843 22 725 29 795 5 787 26 787 4 787 17 887 18 822 459.6 Raymond Mhlaba 27 651 45 334 22 454 22 266 22 266 22 432 25 004 26 846 28 150 11.5 Inxuba Yethemba 8 093 9 316 7 227 8 657 2 940 2 940 8 757 8 940 9 172 197.9 Intsika Yethu 2 433 7 902 3 565 14 850 14 850 12 859 22 990 42 834 44 638 78.8 Emalahleni 9 558 11 529 7 842 11 081 6 509 23 479 6 509 38 381 40 165 260.7 Engcobo 31 758 7 409 41 919 25 644 40 644 37 220 4 740 3 940 4 096 (87.3) Sakhisizwe 1 044 500 4 277 3 691 2 703 2 813 1 762 5 951 6 365 (37.4) Enoch Mgijima 19 015 43 793 50 673 50 642 46 642 30 708 40 300 44 294 46 112 31.2 Elundini 7 222 12 637 6 102 14 601 4 312 13 812 4 312 13 312 14 471 220.3 Senqu 11 742 1 500 5 013 6 678 6 678 8 295 8 206 6 906 7 301 (1.1) Walter Sisulu 15 378 2 000 7 068 8 274 2 557 2 557 8 473 8 657 9 172 231.4 Ngquza Hill 32 889 16 720 13 957 18 643 18 643 14 427 16 495 19 195 19 762 14.3 Port St Johns 36 147 23 775 20 666 5 575 6 003 15 762 8 009 5 903 6 148 96.8 Nyandeni 16 420 8 935 13 128 13 051 13 051 13 119 8 100 13 519 14 792 62.0 Mhlontlo 16 544 16 799 14 385 16 964 2 102 14 102 2 102 17 102 18 152 570.9 King Sabata Dalindyebo 72 092 69 495 90 910 60 067 60 067 58 097 75 765 59 173 62 032 30.4 Matatiele 30 215 28 177 46 683 26 462 4 316 28 916 4 316 28 350 29 306 570.0 Umzimvubu 55 271 54 608 34 048 12 181 12 181 32 131 34 766 31 934 33 599 8.2 Mbizana 13 174 12 880 13 203 16 009 1 147 17 047 1 147 17 147 1 386.2 18 299 Ntabankulu 17 840 30 590 40 950 29 425 32 425 42 530 28 015 20 760 21 243 (34.1)Category C 3 999 1 182 6 265 4 683 4 683 5 302 5 000 5 310 5 750 (5.7)Cacadu District Municipality - - - - - - - - - Amatole District Municipality 3 999 1 182 4 969 2 376 2 376 3 142 2 500 2 710 2 850 (20.4)Chris Hani District Municipality - - - - - - - - - Joe Gqabi District Municipality - - - - - - - - - O.R. Tambo District Municipality - 1 296 - 2 307 - - 2 500 2 600 2 900Alfred Nzo District Municipality - - - - - - - - - Unallocated 1 000 1 000 1 000 1 000 1 000 1 000 14 966 1 000 14 966 - Total transfers to municipalities 880 024 973 036 888 718 872 679 882 921 877 013 1 000 552 910 533 1 099 474 3.82024/25% change from Audited Medium-term Outcome estimate100
