
Page 117 - Demo
P. 117
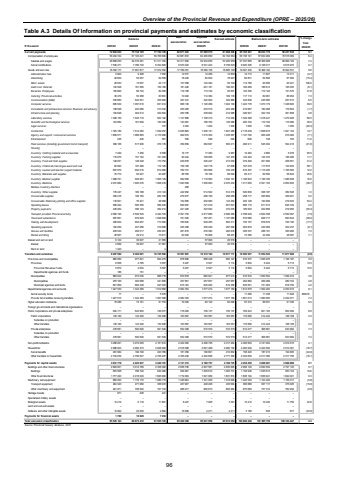
Overview of the Provincial Revenue and Expenditure (OPRE %u2013 2025/26)Table A.3 Details Of Information on provincial payments and estimates by economic classification Outcome Main appropriationAdjustedappropriation Revised estimate Medium-term estimatesR thousand 2021/22 2022/23 2023/24 2025/26 2026/27 2027/28Current payments 72 604 023 75 134 105 77 762 726 80 671 223 81 089 015 81 068 208 85 165 491 86 833 176 90 457 630 5.1Compensation of employ ees 56 204 724 57 103 221 59 766 609 62 881 872 62 465 859 62 162 584 66 158 191 67 834 984 70 515 099 6.4Salaries and w ages 48 668 253 49 316 481 51 311 784 54 311 650 53 934 635 53 405 958 57 337 885 58 636 968 60 899 129 7.4Social contributions 7 536 471 7 786 740 8 454 825 8 570 222 8 531 224 8 756 625 8 820 306 9 198 017 9 615 970 0.7Goods and serv ices 16 393 177 17 991 877 17 974 552 17 789 351 18 566 156 18 885 108 19 007 300 18 998 192 19 942 531 0.6Administrative fees 5 904 9 498 7 952 12 577 14 456 12 800 12 713 11 827 13 311 (0.7)Advertising 48 652 53 957 62 558 78 420 84 832 78 997 66 831 62 828 67 995 (15.4)Minor assets 20 933 13 607 22 117 137 008 124 394 55 709 114 780 90 506 95 241 106.0Audit cost: External 142 528 161 560 159 160 181 446 201 181 196 221 184 289 186 613 195 035 (6.1)Bursaries: Employees 105 890 89 724 82 305 119 108 113 742 93 601 123 356 112 145 121 570 31.8Catering: Provincial activities 30 470 53 388 83 691 74 022 114 384 109 118 117 113 82 061 86 954 7.3Communication (G&S) 335 685 642 551 355 904 397 441 322 902 322 885 343 836 245 600 257 615 6.5Computer services 685 522 1 057 610 831 914 968 130 1 120 289 1 024 139 1 423 778 1 273 179 1 328 820 39.0Consultants and professional services: Business and advisory 158 048 222 086 313 334 255 205 233 515 223 469 219 687 180 488 175 604 (1.7)Infrastructure and planning 194 648 304 013 304 654 250 786 338 902 314 988 326 991 322 154 361 858 3.8Laboratory services 1 306 150 1 040 710 903 192 1 137 889 1 108 313 712 254 1 349 398 1 218 441 1 272 928 89.5Scientific and technological services 143 682 161 699 100 305 143 981 166 764 146 586 200 702 112 724 115 080 36.9Legal services %u2013 %u2013 747 4 254 1 254 1 254 1 000 1 050 1 050 (20.3)Contractors 1 195 180 1 514 282 1 529 257 2 045 695 1 936 141 1 847 286 2 118 239 1 858 673 1 941 124 14.7Agency and support / outsourced services 1 850 571 1 986 865 2 173 999 992 673 1 015 352 1 235 567 1 147 792 905 428 915 469 (7.1)Entertainment 436 446 361 530 546 546 606 748 793 11.0Fleet services (including government motor transport) 396 166 517 906 370 179 359 859 362 607 583 411 460 911 545 304 594 416 (21.0)Housing %u2013 %u2013 %u2013 %u2013 %u2013 %u2013 %u2013 %u2013 %u2013 Inventory: Clothing material and accessories 7 249 7 456 6 558 16 177 17 483 9 967 19 484 4 860 5 078 95.5Inventory: Farming supplies 115 075 151 194 101 403 90 444 128 006 127 470 142 404 142 379 166 480 11.7Inventory: Food and food supplies 148 291 148 248 173 752 230 678 346 247 213 039 279 490 201 900 206 651 31.2Inventory: Chemicals,fuel,oil,gas,wood and coal 84 993 107 466 112 105 159 183 122 718 67 858 107 279 117 673 122 945 58.1Inventory: Learner and teacher support material 607 070 652 016 674 965 782 731 783 666 730 278 819 397 1 115 405 1 165 583 12.2Inventory: Materials and supplies 75 774 93 927 93 487 88 765 78 108 68 020 85 417 60 500 56 844 25.6Inventory: Medical supplies 1 088 791 949 981 1 005 149 992 959 1 110 562 1 032 191 1 196 843 1 196 709 1 286 838 16.0Inventory: Medicine 2 031 884 1 925 076 1 908 416 1 943 559 1 500 993 2 070 433 1 311 600 2 521 153 2 854 603 (36.7)Medsas inventory interface %u2013 %u2013 %u2013 290 %u2013 %u2013 %u2013 %u2013 %u2013 Inventory: Other supplies 176 447 189 188 413 143 442 952 514 522 514 315 520 830 368 187 382 528 1.3Consumable supplies 390 416 198 184 284 729 279 977 268 190 258 269 258 717 295 892 309 921 0.2Consumable: Stationery,printing and office supplies 116 821 76 421 98 069 154 665 202 983 143 454 220 128 193 099 219 523 53.4Operating leases 566 294 595 356 589 445 690 907 721 919 651 641 666 115 611 513 645 749 2.2Property payments 436 264 396 123 362 214 221 405 323 954 372 075 185 003 204 856 219 950 (50.3)Transport provided: Provincial activity 2 060 190 2 539 525 2 494 723 2 391 753 2 817 685 2 996 369 2 788 029 2 604 358 2 552 907 (7.0)Travel and subsistence 987 961 979 640 1 008 693 791 525 787 451 1 137 086 816 686 908 717 893 644 (28.2)Training and development 482 834 654 957 713 364 760 622 929 455 893 311 735 107 676 679 705 190 (17.7)Operating payments 164 259 247 286 319 606 245 398 300 249 287 092 263 833 232 060 254 237 (8.1)Venues and facilities 203 534 200 017 239 291 281 815 276 384 284 918 305 537 288 191 300 900 7.2Rental and hiring 28 567 49 914 73 811 64 522 76 008 68 491 73 380 44 292 48 097 7.1Interest and rent on land 6 122 39 007 21 565 %u2013 57 000 20 516 %u2013 %u2013 %u2013 Interest 4 699 39 007 21 561 %u2013 57 000 20 516 %u2013 %u2013 %u2013 Rent on land 1 423 %u2013 4 %u2013 %u2013 %u2013 %u2013 %u2013 %u2013 Transfers and subsidies 9 287 582 9 304 601 10 725 580 10 597 861 10 372 184 10 677 117 10 580 507 11 054 522 11 677 908 (0.9)Prov inces and municipalities 886 082 977 821 894 275 878 906 888 448 882 127 916 337 1 006 976 1 106 187 3.9Prov inces 6 058 4 785 5 557 6 227 5 527 5 114 5 804 6 424 6 713 13.5Prov incial Rev enue Funds 5 872 4 634 5 557 6 227 5 527 5 114 5 804 6 424 6 713 13.5Departmental agencies and funds 186 151 %u2013 %u2013 %u2013 %u2013 %u2013 %u2013 %u2013 Municipalities 880 024 973 036 888 718 872 679 882 921 877 013 910 533 1 000 552 1 099 474 3.8Municipalities 278 165 303 688 341 685 257 557 257 657 257 657 264 882 269 289 280 724 2.8Municipal agencies and funds 601 859 669 348 547 033 615 122 625 264 619 356 645 651 731 263 818 750 4.2Departmental agencies and accounts 1 447 530 1 344 389 1 912 668 2 084 749 1 677 274 1 677 169 1 812 879 1 992 293 2 253 919 8.1Social security funds 17 %u2013 5 570 %u2013 %u2013 %u2013 11 266 11 338 11 848 #DIV/0!Prov ide list of entities receiv ing transfers 1 447 513 1 344 389 1 907 098 2 084 749 1 677 274 1 677 169 1 801 613 1 980 955 2 242 071 7.4Higher education institutions 75 486 74 161 81 753 79 320 82 120 82 098 87 474 88 551 91 336 6.5Foreign gov ernments and international organisations %u2013 %u2013 %u2013 %u2013 %u2013 %u2013 %u2013 %u2013 %u2013 Public corporations and priv ate enterprises 624 171 643 852 746 077 716 025 736 137 736 137 784 943 821 105 802 090 6.6Public corporations 145 190 143 226 154 528 163 567 163 567 163 567 170 666 214 424 168 108 4.3Subsidies on production %u2013 %u2013 %u2013 %u2013 %u2013 %u2013 %u2013 %u2013 %u2013 Other transfers 145 190 143 226 154 528 163 567 163 567 163 567 170 666 214 424 168 108 4.3Priv ate enterprises 478 981 500 626 591 549 552 458 572 570 572 570 614 277 606 681 633 982 7.3Subsidies on production %u2013 %u2013 %u2013 %u2013 %u2013 %u2013 %u2013 %u2013 %u2013 Other transfers 478 981 500 626 591 549 552 458 572 570 572 570 614 277 606 681 633 982 7.3Non-profit institutions 3 268 291 3 274 005 4 161 814 4 322 263 4 296 736 4 317 454 4 495 845 4 741 004 4 912 015 4.1Households 2 986 023 2 990 373 2 928 993 2 516 598 2 691 468 2 982 132 2 483 029 2 404 593 2 512 361 (16.7)Social benefits 261 984 199 746 223 766 181 359 196 801 210 832 158 420 187 213 194 605 (24.9)Other transfers to households 2 724 039 2 790 627 2 705 227 2 335 239 2 494 668 2 771 300 2 324 609 2 217 380 2 317 756 (16.1)Payments for capital assets 3 631 778 4 223 937 3 440 181 4 131 313 4 180 757 4 166 735 4 254 250 3 808 061 3 968 889 2.1Buildings and other fix ed structures 2 648 001 3 014 789 2 338 362 2 658 736 2 827 581 2 835 605 2 998 130 2 692 554 2 797 145 5.7Buildings 870 508 796 740 642 460 939 397 1 205 612 1 003 731 1 159 936 1 035 613 953 124 15.6Other fix ed structures 1 777 493 2 218 049 1 695 902 1 719 339 1 621 969 1 831 874 1 838 194 1 656 941 1 844 021 0.3Machinery and equipment 956 294 1 179 172 1 086 715 1 445 624 1 341 039 1 319 628 1 242 540 1 104 429 1 159 317 (5.8)Transport equipment 464 323 471 080 358 972 457 207 448 226 435 664 366 880 367 117 375 025 (15.8)Other machinery and equipment 491 971 708 092 727 743 988 417 892 813 883 964 875 660 737 312 784 292 (0.9)Heritage Assets 971 228 441 %u2013 %u2013 %u2013 %u2013 %u2013 %u2013 Specialised military assets %u2013 %u2013 %u2013 %u2013 %u2013 %u2013 %u2013 %u2013 %u2013 Biological assets 14 419 6 118 11 801 8 447 7 926 7 291 10 412 10 430 11 750 42.8Land and sub-soil assets %u2013 %u2013 %u2013 %u2013 %u2013 %u2013 %u2013 %u2013 %u2013 Softw are and other intangible assets 12 092 23 630 2 862 18 506 4 211 4 211 3 168 648 677 (24.8)Payments for financial assets 1 760 10 829 7 233 %u2013 %u2013 %u2013 %u2013 %u2013 %u2013 Total economic classification 85 525 143 88 673 472 91 935 720 95 400 398 95 641 956 95 912 060 100 000 248 101 695 759 106 104 427 4.3Source: Provincial treasury database, 2025% change from 2024/25 2024/2596
