
Page 158 - Demo
P. 158
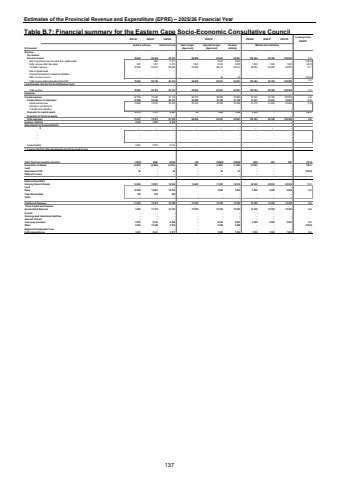
Estimates of the Provincial Revenue and Expenditure (EPRE) %u2013 2025/26 Financial Year Table B.7: Financial summary for the Eastern Cape Socio-Economic Consultative Council 2021/22 2022/23 2023/24 2024/25 2025/26 2026/27 2027/28 % change from 2024/25R thousand Audited outcome Actual outcome Main budget (Approved)Adjusted budget (Approved)Revised estimateRevenueTax revenue - - - - - - - - -Non-tax revenue 79 842 86 166 93 574 86 828 92 261 92 261 100 364 96 188 100 509 8.8Sale of goods and services other than capital assets - 896 2 517 - 3 624 3 624 - - - (100.0)Entity revenue other than sales 997 1 457 2 372 1 500 2 000 2 000 1 500 1 500 1 500 (25.0)Transfers received 78 845 83 813 88 685 85 328 86 612 86 612 98 864 94 688 99 009 14.1Sale of capital assets - - - - - - - - -Financial transactions in assets and liabilities - - - - - - - - -Other non-tax revenue - - - - 25 25 - - - (100.0)Total revenue before deposits into the PRF 79 842 86 166 93 574 86 828 92 261 92 261 100 364 96 188 100 509 8.8Less Deposits into the Provincial Revenue Fund - - - - - - - - -Total revenue 79 842 86 166 93 574 86 828 92 261 92 261 100 364 96 188 100 509 8.8ExpensesCurrent expense 62 792 70 420 81 175 86 778 90 856 90 856 97 044 96 188 100 509 6.8Compensation of employees 47 808 54 446 60 751 66 400 67 392 67 392 75 431 74 534 78 023 11.9Goods and services 14 984 15 974 20 424 20 378 23 464 23 464 21 613 21 654 22 486 (7.9)Interest on rent and land - - - - - - - - -Transfers and subsidies - - - - - - - - -Payments for capital assets 12 415 7 913 6 065 50 1 405 1 405 3 320 - - 136.3Payments for financial assets - - - - - - - - -Total expenses 75 207 78 333 87 240 86 828 92 261 92 261 100 364 96 188 100 509 8.8Surplus / (Deficit) 4 635 7 833 6 334 - - - - - -Adjustments for Surplus/(Deficit)0 - - - - - - - - - - %u2013 - - - - - - - - - - %u2013 - - - - - - - - - - %u2013 - - - - - - - - - -Surplus/(deficit) - 4 635 7 833 6 334 - - - - - -1. Surplus/ (Deficit) after adjustments should be equal to zero.Cash flow from investing activities (7638) 4568 (2004) (50) (16658) (16658) (500) 400 200 (97.0)Acquisition of Assets (9 309) (2 694) (5 234) (50) (1 405) (1 405) (3 320) - - 136.3Land - - - - - - - - -Disposals of PPE 52 - 24 - 25 25 - - - (100.0)Deferred Income - - - - - - - - -Balance Sheet DataCarrying Value of Assets 12 029 12 957 16 352 16 402 17 807 19 212 22 532 22 532 22 532 17.3Land - - - - - - - - -Bank 10 389 14 801 12 618 5 000 5 000 5 000 5 000 5 000 0.0Trade Receivables 159 253 280 - - - - - -Trade - - - - - - - - -Capital and Reserves 11 653 12 755 15 790 15 790 15 790 15 790 15 790 15 790 15 790 0.0Share Capital and Premium - - - - - - - - - Accumulated Reserves 3 305 11 710 12 755 15 790 15 790 15 790 15 790 15 790 15 790 0.0Current - - - - - - - - -Unrecognised transitional liabilities - - - - - - - - -Accrued Interest - - - - - - - - -Leave pay provision 2 078 2 535 2 496 - 2 500 2 500 2 500 2 500 2 500 0.0Other 9 083 13 389 9 576 - 5 000 5 000 - - - (100.0)Regional Development Fund - - - - - - - - -Performance Bonus 3 457 5 431 5 377 - 7 000 7 000 7 000 7 000 7 000 0.0Medium-term estimates137
