
Page 152 - Demo
P. 152
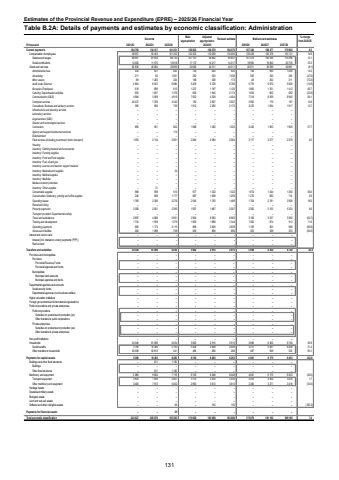
Estimates of the Provincial Revenue and Expenditure (EPRE) %u2013 2025/26 Financial Year Table B.2A: Details of payments and estimates by economic classification: Administration Outcome Main appropriationAdjusted appropriation Revised estimate Medium-term estimates % change from 2024/25R thousand 2021/22 2022/23 2023/24 2025/26 2026/27 2027/28Current payments 134 317 164 793 141 251 158 923 154 570 154 570 167 340 168 477 175 992 8.3Compensation of employees 98 957 93 453 101 352 124 323 110 059 110 059 126 429 129 378 135 131 14.9Salaries and wages 86 957 81 878 88 734 107 151 95 842 95 841 107 479 109 536 114 396 12.1Social contributions 12 000 11 575 12 618 17 172 14 217 14 217 18 950 19 842 20 735 33.3Goods and services 65 836 40 864 39 899 34 600 44 511 44 511 40 911 39 099 40 861 (8.1)Administrative fees 434 621 625 720 620 620 708 994 1 040 14.2Advertising 211 82 1 051 252 553 1 038 550 335 350 (47.0)Minor assets 88 1 203 224 198 526 173 48 202 211 (72.3)Audit costs: External 4 934 6 047 6 896 5 439 6 729 6 786 5 776 5 670 5 926 (14.9)Bursaries: Employees 618 899 615 1 237 1 187 1 120 1 800 1 351 1 412 60.7Catering: Departmental activities 655 1 607 1 376 656 1 945 2 174 1 654 662 692 (23.9)Communication (G&S) 4 984 3 568 4 919 7 932 4 329 4 404 7 314 8 559 8 945 66.1Computer services 40 437 7 359 4 342 150 2 607 2 607 2 992 179 187 14.8Consultants: Business and advisory services 395 900 739 1 912 2 285 2 172 2 470 1 834 1 917 13.7Infrastructure and planning services %u2013 %u2013 %u2013 %u2013 %u2013 %u2013 %u2013 %u2013 %u2013Laboratory services %u2013 %u2013 %u2013 %u2013 %u2013 %u2013 %u2013 %u2013 %u2013Legal services (G&S) %u2013 %u2013 %u2013 %u2013 %u2013 %u2013 %u2013 %u2013 %u2013Science and technological services %u2013 %u2013 %u2013 %u2013 %u2013 %u2013 %u2013 %u2013 %u2013Contractors 885 951 802 1 668 1 282 1 225 2 422 1 823 1 905 97.7Agency and support/outsourced services %u2013 %u2013 114 %u2013 %u2013 %u2013 %u2013 %u2013 %u2013Entertainment %u2013 %u2013 %u2013 %u2013 %u2013 %u2013 %u2013 %u2013 %u2013Fleet services (including government motor transport) 1 093 2 134 2 061 2 084 2 084 2 084 2 177 2 277 2 379 4.5Housing %u2013 %u2013 %u2013 %u2013 %u2013 %u2013 %u2013 %u2013 %u2013Inventory: Clothing material and accessories %u2013 %u2013 %u2013 %u2013 %u2013 %u2013 %u2013 %u2013 %u2013Inventory: Farming supplies %u2013 %u2013 %u2013 %u2013 %u2013 %u2013 %u2013 %u2013 %u2013Inventory: Food and food supplies %u2013 %u2013 %u2013 %u2013 %u2013 %u2013 %u2013 %u2013 %u2013Inventory: Fuel, oil and gas %u2013 %u2013 %u2013 %u2013 %u2013 %u2013 %u2013 %u2013 %u2013Inventory: Learner and teacher support material %u2013 %u2013 %u2013 %u2013 %u2013 %u2013 %u2013 %u2013 %u2013Inventory: Materials and supplies %u2013 %u2013 34 %u2013 %u2013 %u2013 %u2013 %u2013 %u2013Inventory: Medical supplies %u2013 %u2013 %u2013 %u2013 %u2013 %u2013 %u2013 %u2013 %u2013Inventory: Medicine %u2013 %u2013 %u2013 %u2013 %u2013 %u2013 %u2013 %u2013 %u2013Medsas inventory interface %u2013 %u2013 %u2013 %u2013 %u2013 %u2013 %u2013 %u2013 %u2013Inventory: Other supplies %u2013 31 %u2013 %u2013 %u2013 %u2013 %u2013 %u2013 %u2013Consumable supplies 988 598 510 977 1 322 1 322 1 674 1 244 1 300 26.6Consumables: Stationery, printing and office supplies 246 658 1 177 887 1 008 1 259 1 270 683 714 0.9Operating leases 1 785 2 309 2 276 2 545 1 792 1 489 1 764 2 781 2 906 18.5Rental and hiring %u2013 %u2013 %u2013 %u2013 %u2013 %u2013 %u2013 %u2013 %u2013Property payments 2 306 2 821 2 295 1 957 1 867 2 007 2 200 5 103 5 333 9.6Transport provided: Departmental activity %u2013 %u2013 %u2013 %u2013 %u2013 %u2013 %u2013 %u2013 %u2013Travel and subsistence 2 897 4 866 5 691 2 904 8 962 8 962 3 160 3 237 3 382 (64.7)Training and development 1 734 1 939 1 279 1 693 1 688 1 344 1 500 874 913 11.6Operating payments 882 1 173 2 115 889 2 829 2 829 1 109 953 996 (60.8)Venues and facilities 264 1 098 758 500 896 896 323 338 353 (64.0)Interest and rent on land %u2013 %u2013 %u2013 %u2013 %u2013 %u2013 %u2013 %u2013 %u2013Interest (Incl. interest on unitary payments (PPP)) %u2013 %u2013 %u2013 %u2013 %u2013 %u2013 %u2013 %u2013 %u2013Rent on land %u2013 %u2013 %u2013 %u2013 %u2013 %u2013 %u2013 %u2013 %u2013Transfers and subsidies 54 348 61 096 6 034 5 902 2 915 2 915 3 698 6 450 6 740 26.9 Provinces and municipalities %u2013 %u2013 %u2013 %u2013 %u2013 %u2013 %u2013 %u2013 %u2013Provinces %u2013 %u2013 %u2013 %u2013 %u2013 %u2013 %u2013 %u2013 %u2013Provincial Revenue Funds %u2013 %u2013 %u2013 %u2013 %u2013 %u2013 %u2013 %u2013 %u2013Provincial agencies and funds %u2013 %u2013 %u2013 %u2013 %u2013 %u2013 %u2013 %u2013 %u2013Municipalities %u2013 %u2013 %u2013 %u2013 %u2013 %u2013 %u2013 %u2013 %u2013Municipal bank accounts %u2013 %u2013 %u2013 %u2013 %u2013 %u2013 %u2013 %u2013 %u2013Municipal agencies and funds %u2013 %u2013 %u2013 %u2013 %u2013 %u2013 %u2013 %u2013 %u2013Departmental agencies and accounts %u2013 %u2013 %u2013 %u2013 %u2013 %u2013 %u2013 %u2013 %u2013Social security funds %u2013 %u2013 %u2013 %u2013 %u2013 %u2013 %u2013 %u2013 %u2013Departmental agencies (non-business entities) %u2013 %u2013 %u2013 %u2013 %u2013 %u2013 %u2013 %u2013 %u2013Higher education institutions %u2013 %u2013 %u2013 %u2013 %u2013 %u2013 %u2013 %u2013 %u2013Foreign governments and international organisations %u2013 %u2013 %u2013 %u2013 %u2013 %u2013 %u2013 %u2013 %u2013Public corporations and private enterprises %u2013 %u2013 %u2013 %u2013 %u2013 %u2013 %u2013 %u2013 %u2013Public corporations %u2013 %u2013 %u2013 %u2013 %u2013 %u2013 %u2013 %u2013 %u2013Subsidies on products and production (pc) %u2013 %u2013 %u2013 %u2013 %u2013 %u2013 %u2013 %u2013 %u2013Other transfers to public corporations %u2013 %u2013 %u2013 %u2013 %u2013 %u2013 %u2013 %u2013 %u2013Private enterprises %u2013 %u2013 %u2013 %u2013 %u2013 %u2013 %u2013 %u2013 %u2013Subsidies on products and production (pe) %u2013 %u2013 %u2013 %u2013 %u2013 %u2013 %u2013 %u2013 %u2013Other transfers to private enterprises %u2013 %u2013 %u2013 %u2013 %u2013 %u2013 %u2013 %u2013 %u2013Non-profit institutions %u2013 %u2013 %u2013 %u2013 %u2013 %u2013 %u2013 %u2013 %u2013Households 54 348 61 096 6 034 5 902 2 915 2 915 3 698 6 450 6 740 26.9Social benefits 3 790 10 284 5 793 5 436 2 649 2 649 3 211 5 941 6 208 21.2Other transfers to households 50 558 50 812 241 466 266 266 487 509 532 83.1Payments for capital assets 5 386 10 463 8 285 6 103 6 203 6 203 4 841 6 175 6 453 (22.0)Buildings and other fixed structures %u2013 611 1 100 %u2013 %u2013 %u2013 %u2013 %u2013 %u2013Buildings %u2013 %u2013 %u2013 %u2013 %u2013 %u2013 %u2013 %u2013 %u2013Other fixed structures %u2013 611 1 100 %u2013 %u2013 %u2013 %u2013 %u2013 %u2013Machinery and equipment 5 386 9 852 7 119 6 103 6 048 6 048 4 841 6 175 6 453 (20.0)Transport equipment 2 923 1 939 2 067 3 110 2 435 2 435 2 476 2 904 3 035 1.7Other machinery and equipment 2 463 7 913 5 052 2 993 3 613 3 613 2 365 3 271 3 418 (34.5)Heritage Assets %u2013 %u2013 %u2013 %u2013 %u2013 %u2013 %u2013 %u2013 %u2013Specialised military assets %u2013 %u2013 %u2013 %u2013 %u2013 %u2013 %u2013 %u2013 %u2013Biological assets %u2013 %u2013 %u2013 %u2013 %u2013 %u2013 %u2013 %u2013 %u2013Land and sub-soil assets %u2013 %u2013 %u2013 %u2013 %u2013 %u2013 %u2013 %u2013 %u2013Software and other intangible assets %u2013 %u2013 66 %u2013 155 155 %u2013 %u2013 %u2013 (100.0)Payments for financial assets %u2013 %u2013 25 %u2013 %u2013 %u2013 %u2013 %u2013 %u2013Total economic classification 224 527 205 876 155 595 170 928 163 688 163 688 175 879 181 102 189 185 7.42024/25131
