
Page 170 - Demo
P. 170
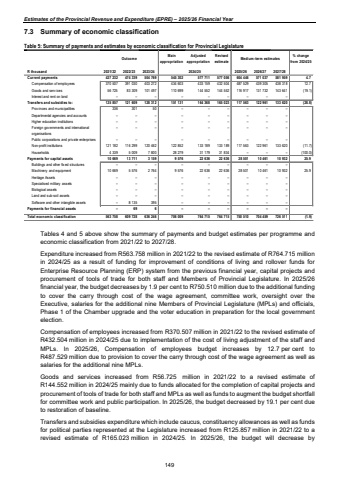
Estimates of the Provincial Revenue and Expenditure (EPRE) %u2013 2025/26 Financial Year7.3 Summary of economic classification Table 5: Summary of payments and estimates by economic classification for Provincial Legislature OutcomeMain appropriationAdjusted appropriationRevised estimate Medium-term estimates % change from 2024/25R thousand 2021/22 2022/23 2023/24 2025/26 2026/27 2027/28Current payments 427 232 474 339 504 769 545 302 577 056 577 711 604 446 571 037 581 959 4.7Compensation of employ ees 391 030 403 272 370 507 434 603 432 504 433 159 487 529 439 305 438 318 12.7Goods and serv ices 83 309 101 497 56 725 110 699 144 552 144 552 116 917 131 732 143 641 (19.1)Interest and rent on land %u2013 %u2013 %u2013 %u2013 %u2013 %u2013 %u2013 %u2013 %u2013Transfers and subsidies to: 121 609 128 312 125 857 151 131 165 023 164 368 117 563 122 961 133 620 (28.8)Prov inces and municipalities 301 336 50 %u2013 %u2013 %u2013 %u2013 %u2013 %u2013Departmental agencies and accounts %u2013 %u2013 %u2013 %u2013 %u2013 %u2013 %u2013 %u2013 %u2013Higher education institutions %u2013 %u2013 %u2013 %u2013 %u2013 %u2013 %u2013 %u2013 %u2013Foreign gov ernments and international organisations %u2013 %u2013 %u2013 %u2013 %u2013 %u2013 %u2013 %u2013 %u2013 Public corporations and priv ate enterprises %u2013 %u2013 %u2013 %u2013 %u2013 %u2013 %u2013 %u2013 %u2013Non-profit institutions 116 299 120 462 121 182 122 852 133 189 133 189 117 563 122 961 133 620 (11.7)Households 4 5 009 7 800 339 28 279 31 834 31 179 %u2013 %u2013 %u2013 (100.0)Payments for capital assets 13 711 10 669 3 159 9 576 22 636 28 501 10 461 10 932 22 636 25.9Buildings and other fix ed structures %u2013 %u2013 %u2013 %u2013 %u2013 %u2013 %u2013 %u2013 %u2013Machinery and equipment 10 669 5 576 2 764 9 576 22 636 28 501 10 461 10 932 22 636 25.9Heritage Assets %u2013 %u2013 %u2013 %u2013 %u2013 %u2013 %u2013 %u2013 %u2013Specialised military assets %u2013 %u2013 %u2013 %u2013 %u2013 %u2013 %u2013 %u2013 %u2013Biological assets %u2013 %u2013 %u2013 %u2013 %u2013 %u2013 %u2013 %u2013 %u2013Land and sub-soil assets %u2013 %u2013 %u2013 %u2013 %u2013 %u2013 %u2013 %u2013 %u2013 Softw are and other intangible assets 8 135 %u2013 395 %u2013 %u2013 %u2013 %u2013 %u2013 %u2013Payments for financial assets 69 6 %u2013 %u2013 %u2013 %u2013 %u2013 %u2013 %u2013Total economic classification 609 728 636 246 563 758 706 009 764 715 764 715 750 510 704 459 726 511 (1.9)2024/25 Tables 4 and 5 above show the summary of payments and budget estimates per programme and economic classification from 2021/22 to 2027/28. Expenditure increased from R563.758 million in 2021/22 to the revised estimate of R764.715 million in 2024/25 as a result of funding for improvement of conditions of living and rollover funds for Enterprise Resource Planning (ERP) system from the previous financial year, capital projects and procurement of tools of trade for both staff and Members of Provincial Legislature. In 2025/26 financial year, the budget decreases by 1.9 per cent to R750.510 million due to the additional funding to cover the carry through cost of the wage agreement, committee work, oversight over the Executive, salaries for the additional nine Members of Provincial Legislature (MPLs) and officials, Phase 1 of the Chamber upgrade and the voter education in preparation for the local government election. Compensation of employees increased from R370.507 million in 2021/22 to the revised estimate of R432.504 million in 2024/25 due to implementation of the cost of living adjustment of the staff and MPLs. In 2025/26, Compensation of employees budget increases by 12.7 per cent to R487.529 million due to provision to cover the carry through cost of the wage agreement as well as salaries for the additional nine MPLs. Goods and services increased from R56.725 million in 2021/22 to a revised estimate of R144.552 million in 2024/25 mainly due to funds allocated for the completion of capital projects and procurement of tools of trade for both staff and MPLs as well as funds to augment the budget shortfall for committee work and public participation. In 2025/26, the budget decreased by 19.1 per cent due to restoration of baseline. Transfers and subsidies expenditure which include caucus, constituency allowances as well as funds for political parties represented at the Legislature increased from R125.857 million in 2021/22 to a revised estimate of R165.023 million in 2024/25. In 2025/26, the budget will decrease by 149
