
Page 273 - Demo
P. 273
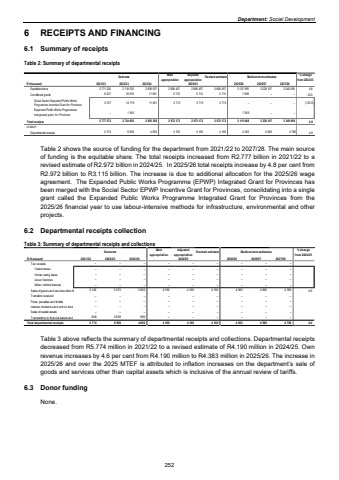
Department: Social Development6 RECEIPTS AND FINANCING 6.1 Summary of receipts Table 2: Summary of departmental receipts Outcome Main appropriationAdjusted appropriation Revised estimate Medium-term estimates % change from 2024/25R thousand 2021/22 2022/23 2023/24 2025/26 2026/27 2027/28Equitable share 2 718 032 2 771 035 2 838 537 2 966 457 2 966 457 2 966 457 3 107 990 3 228 107 3 340 096 4.8Conditional grants 16 618 6 537 11 851 5 715 5 715 5 715 7 658 %u2013 %u2013 34.0Social Sector Expanded Public Works Programme Incentive Grant for Provinces 14 718 6 537 11 851 5 715 5 715 5 715 %u2013 %u2013 %u2013 (100.0)Expanded Public Works Programmes Intergrated grant for Provinces 1 900 %u2013 %u2013 7 658 %u2013 Total receipts 2 734 650 2 777 572 2 850 388 2 972 172 2 972 172 2 972 172 3 115 648 3 228 107 3 340 096 4.8of whichDepartmental receipts 9 508 5 774 4 692 4 190 4 190 4 190 4 383 4 580 4 786 4.62024/25 Table 2 shows the source of funding for the department from 2021/22 to 2027/28. The main source of funding is the equitable share. The total receipts increased from R2.777 billion in 2021/22 to a revised estimate of R2.972 billion in 2024/25. In 2025/26 total receipts increase by 4.8 per cent from R2.972 billion to R3.115 billion. The increase is due to additional allocation for the 2025/26 wage agreement. The Expanded Public Works Programme (EPWP) Integrated Grant for Provinces has been merged with the Social Sector EPWP Incentive Grant for Provinces, consolidating into a single grant called the Expanded Public Works Programme Integrated Grant for Provinces from the 2025/26 financial year to use labour-intensive methods for infrastructure, environmental and other projects. 6.2 Departmental receipts collection Table 3: Summary of departmental receipts and collections Outcome Main appropriationAdjusted appropriation Revised estimate Medium-term estimates % change from 2024/25R thousand 2021/22 2022/23 2023/24 2025/26 2026/27 2027/28Tax receipts %u2013 %u2013 %u2013 %u2013 %u2013 %u2013 %u2013 %u2013 %u2013Casino taxes %u2013 %u2013 %u2013 %u2013 %u2013 %u2013 %u2013 %u2013 %u2013Horse racing taxes %u2013 %u2013 %u2013 %u2013 %u2013 %u2013 %u2013 %u2013 %u2013Liquor licences %u2013 %u2013 %u2013 %u2013 %u2013 %u2013 %u2013 %u2013 %u2013Motor vehicle licences %u2013 %u2013 %u2013 %u2013 %u2013 %u2013 %u2013 %u2013 %u2013Sales of goods and services other th 3 570 5 126 3 802 4 190 4 190 4 190 4 383 4 580 4 786 4.6Transfers received %u2013 %u2013 %u2013 %u2013 %u2013 %u2013 %u2013 %u2013 %u2013Fines, penalties and forfeits %u2013 %u2013 %u2013 %u2013 %u2013 %u2013 %u2013 %u2013 %u2013Interest, dividends and rent on land %u2013 %u2013 %u2013 %u2013 %u2013 %u2013 %u2013 %u2013 %u2013Sales of capital assets %u2013 %u2013 %u2013 %u2013 %u2013 %u2013 %u2013 %u2013 %u2013Transactions in financial assets and 648 5 938 890 %u2013 %u2013 %u2013 %u2013 %u2013 %u2013Total departmental receipts 5 774 9 508 4 692 4 190 4 190 4 190 4 383 4 580 4 786 4.62024/25Table 3 above reflects the summary of departmental receipts and collections. Departmental receipts decreased from R5.774 million in 2021/22 to a revised estimate of R4.190 million in 2024/25. Own revenue increases by 4.6 per cent from R4.190 million to R4.383 million in 2025/26. The increase in 2025/26 and over the 2025 MTEF is attributed to inflation increases on the department%u2019s sale of goods and services other than capital assets which is inclusive of the annual review of tariffs. 6.3 Donor funding None. 252
