
Page 276 - Demo
P. 276
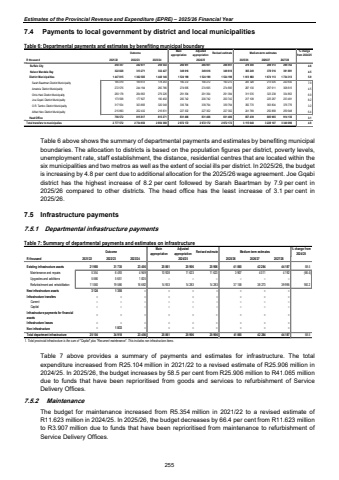
Estimates of the Provincial Revenue and Expenditure (EPRE) %u2013 2025/26 Financial Year7.4 Payments to local government by district and local municipalities Table 6: Departmental payments and estimates by benefiting municipal boundary Outcome Main appropriationAdjusted appropriation Revised estimate Medium-term estimates % change from 2024/25R thousand 2021/22 2022/23 2023/24 2025/26 2026/27 2027/28 Buffalo City 242 977 250 357 256 544 266 951 266 951 266 951 279 300 289 513 299 762 4.6 Nelson Mandela Bay 322 828 313 271 332 427 349 616 349 616 349 616 365 249 378 516 391 891 4.5District Municipalities 1 447 815 1 362 585 1 446 146 1 524 199 1 524 199 1 524 199 1 613 660 1 674 113 1 734 313 5.9Sarah Baartman District Municipality 185 019 169 613 178 263 190 272 190 272 190 272 205 328 213 005 220 630 7.9Amatole District Municipality 272 576 244 194 260 786 274 695 274 695 274 695 287 130 297 911 308 615 4.5Chris Hani District Municipality 283 178 264 663 279 226 291 394 291 394 291 394 311 535 323 238 334 853 6.9Joe Gqabi District Municipality 173 598 177 827 190 492 200 742 200 742 200 742 217 108 225 287 233 491 8.2O.R. Tambo District Municipality 317 554 303 856 320 548 339 794 339 794 339 794 350 770 363 804 376 776 3.2Alfred Nzo District Municipality 215 890 202 432 216 831 227 302 227 302 227 302 241 789 250 868 259 948 6.4Head Office 756 572 815 817 815 271 831 406 831 406 831 406 857 439 885 965 914 130 3.1Total transfers to municipalies 2 777 572 2 734 650 2 850 388 2 972 172 2 972 172 2 972 172 3 115 648 3 228 107 3 340 096 4.82024/25Table 6 above shows the summary of departmental payments and estimates by benefiting municipal boundaries. The allocation to districts is based on the population figures per district, poverty levels, unemployment rate, staff establishment, the distance, residential centres that are located within the six municipalities and two metros as well as the extent of social ills per district. In 2025/26, the budget is increasing by 4.8 per cent due to additional allocation for the 2025/26 wage agreement. Joe Gqabi district has the highest increase of 8.2 per cent followed by Sarah Baartman by 7.9 per cent in 2025/26 compared to other districts. The head office has the least increase of 3.1 per cent in 2025/26. 7.5 Infrastructure payments 7.5.1 Departmental infrastructure payments Table 7: Summary of departmental payments and estimates on infrastructure Outcome Main appropriationAdjusted appropriation Revised estimate Medium-term estimates % change from 2024/25R thousand 2021/22 2022/23 2023/24 2025/26 2026/27 2027/28Existing infrastructure assets 31 730 21 980 23 456 25 861 25 906 25 906 41 065 42 284 44 187 58.5Maintenance and repairs 6 493 5 354 4 949 10 928 11 623 11 623 3 907 4 011 4 192 (66.4)Upgrades and additions 5 651 5 566 1 825 %u2013 %u2013 %u2013 %u2013 %u2013 %u2013 Refurbishment and rehabilitation 19 586 11 060 16 682 14 933 14 283 14 283 37 158 38 273 39 995 160.2New infrastructure assets 1 355 3 124 %u2013 %u2013 %u2013 %u2013 %u2013 %u2013 %u2013 Infrastructure transfers %u2013 %u2013 %u2013 %u2013 %u2013 %u2013 %u2013 %u2013 %u2013 Current %u2013 %u2013 %u2013 %u2013 %u2013 %u2013 %u2013 %u2013 %u2013 Capital %u2013 %u2013 %u2013 %u2013 %u2013 %u2013 %u2013 %u2013 %u2013 Infrastructure payments for financial assets %u2013 %u2013 %u2013 %u2013 %u2013 %u2013 %u2013 %u2013 %u2013Infrastructure leases %u2013 %u2013 %u2013 %u2013 %u2013 %u2013 %u2013 %u2013 %u2013Non infrastructure %u2013 1 833 %u2013 %u2013 %u2013 %u2013 %u2013 %u2013 %u2013Total department infrastructure 25 104 34 918 23 456 25 861 25 906 25 906 41 065 42 284 44 187 58.51. Total provincial infrastructure is the sum of \s non infrastructure items.2024/25Table 7 above provides a summary of payments and estimates for infrastructure. The total expenditure increased from R25.104 million in 2021/22 to a revised estimate of R25.906 million in 2024/25. In 2025/26, the budget increases by 58.5 per cent from R25.906 million to R41.065 million due to funds that have been reprioritised from goods and services to refurbishment of Service Delivery Offices. 7.5.2 Maintenance The budget for maintenance increased from R5.354 million in 2021/22 to a revised estimate of R11.623 million in 2024/25. In 2025/26, the budget decreases by 66.4 per cent from R11.623 million to R3.907 million due to funds that have been reprioritised from maintenance to refurbishment of Service Delivery Offices. 255
