
Page 582 - Demo
P. 582
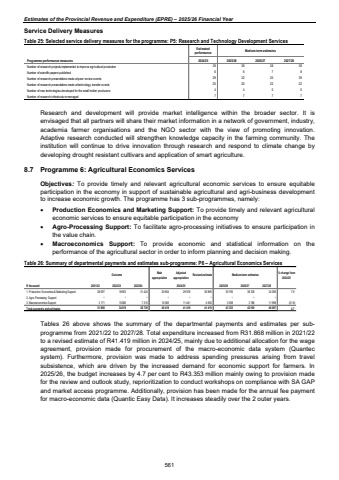
Estimates of the Provincial Revenue and Expenditure (EPRE) %u2013 2025/26 Financial YearService Delivery Measures Table 25: Selected service delivery measures for the programme: P5: Research and Technology Development Services Estimatedperformance Medium-term estimatesProgramme performance measures 2024/25 2025/26 2026/27 2027/28Number of research projects implemented to improve agricultural production 38 38 38 38 Number of scientific papers published. 6 6 7 8 Number of research presentations made at peer review events 32 29 35 39 Number of research presentations made at technology transfer events 20 20 22 22 Number of new technologies developed for the small holder producers 4 4 5 5 Number of research infrastructure managed 7 7 7 7 Research and development will provide market intelligence within the broader sector. It is envisaged that all partners will share their market information in a network of government, industry, academia farmer organisations and the NGO sector with the view of promoting innovation. Adaptive research conducted will strengthen knowledge capacity in the farming community. The institution will continue to drive innovation through research and respond to climate change by developing drought resistant cultivars and application of smart agriculture. 8.7 Programme 6: Agricultural Economics Services Objectives: To provide timely and relevant agricultural economic services to ensure equitable participation in the economy in support of sustainable agricultural and agri-business development to increase economic growth. The programme has 3 sub-programmes, namely: %uf0b7 Production Economics and Marketing Support: To provide timely and relevant agricultural economic services to ensure equitable participation in the economy%uf0b7 Agro-Processing Support: To facilitate agro-processing initiatives to ensure participation in the value chain. %uf0b7 Macroeconomics Support: To provide economic and statistical information on the performance of the agricultural sector in order to inform planning and decision making. Table 26: Summary of departmental payments and estimates sub-programme: P6 %u2013 Agricultural Economics Services Outcome Main appropriationAdjusted appropriation Revised estimate Medium-term estimates % change from 2024/25R thousand 2021/22 2022/23 2023/24 2025/26 2026/27 2027/281. Production Economics & Marketing Support 18 953 28 697 31 424 29 854 29 978 36 869 39 795 38 329 34 099 7.92. Agro-Processing Support %u2013 %u2013 %u2013 %u2013 %u2013 %u2013 %u2013 %u2013 %u20133. Macroeconomics Support 3 171 15 566 7 315 10 565 11 441 4 550 3 558 3 780 11 998 (21.8)Total payments and estimates 31 868 34 519 38 739 40 419 41 419 41 419 43 353 42 109 46 097 4.72024/25 Tables 26 above shows the summary of the departmental payments and estimates per subprogramme from 2021/22 to 2027/28. Total expenditure increased from R31.868 million in 2021/22 to a revised estimate of R41.419 million in 2024/25, mainly due to additional allocation for the wage agreement, provision made for procurement of the macro-economic data system (Quantec system). Furthermore, provision was made to address spending pressures arising from travel subsistence, which are driven by the increased demand for economic support for farmers. In 2025/26, the budget increases by 4.7 per cent to R43.353 million mainly owing to provision made for the review and outlook study, reprioritization to conduct workshops on compliance with SA GAP and market access programme. Additionally, provision has been made for the annual fee payment for macro-economic data (Quantic Easy Data). It increases steadily over the 2 outer years. 561
