
Page 577 - Demo
P. 577
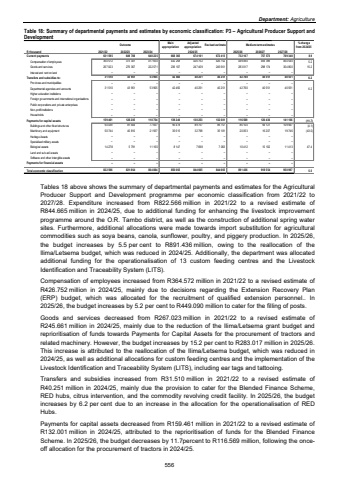
Department: AgricultureTable 18: Summary of departmental payments and estimates by economic classification: P3 %u2013 Agricultural Producer Support and Development Outcome Main appropriationAdjusted appropriation Revised estimate Medium-term estimates % change from 2024/25R thousand 2021/22 2022/23 2023/24 2025/26 2026/27 2027/28Current payments 649 708 631 595 640 225 668 365 674 161 672 413 732 107 757 573 769 340 8.9Compensation of employees 373 341 364 572 417 654 432 258 426 752 426 752 449 090 459 399 464 540 5.2Goods and services 276 367 267 023 222 571 236 107 247 409 245 661 283 017 298 174 304 800 15.2Interest and rent on land %u2013 %u2013 %u2013 %u2013 %u2013 %u2013 %u2013 %u2013 %u2013 Transfers and subsidies to: 43 951 31 510 53 905 42 460 40 251 40 251 42 760 40 551 40 551 6.2Provinces and municipalities %u2013 %u2013 %u2013 %u2013 %u2013 %u2013 %u2013 %u2013 %u2013 Departmental agencies and accounts 43 951 31 510 53 905 42 460 40 251 40 251 42 760 40 551 40 551 6.2Higher education institutions %u2013 %u2013 %u2013 %u2013 %u2013 %u2013 %u2013 %u2013 %u2013Foreign governments and international organisations %u2013 %u2013 %u2013 %u2013 %u2013 %u2013 %u2013 %u2013 %u2013Public corporations and private enterprises %u2013 %u2013 %u2013 %u2013 %u2013 %u2013 %u2013 %u2013 %u2013Non-profit institutions %u2013 %u2013 %u2013 %u2013 %u2013 %u2013 %u2013 %u2013 %u2013Households %u2013 %u2013 %u2013 %u2013 %u2013 %u2013 %u2013 %u2013 %u2013Payments for capital assets 159 461 128 205 110 754 139 240 130 253 132 001 116 569 120 430 141 106 (11.7)Buildings and other fixed structures 94 439 81 604 77 657 95 478 89 757 89 757 86 104 94 121 109 947 (4.1)Machinery and equipment 50 744 40 810 21 937 35 615 32 798 35 181 20 053 16 207 19 746 (43.0)Heritage Assets %u2013 %u2013 %u2013 %u2013 %u2013 %u2013 %u2013 %u2013 %u2013Specialised military assets %u2013 %u2013 %u2013 %u2013 %u2013 %u2013 %u2013 %u2013 %u2013Biological assets 14 278 5 791 11 160 8 147 7 698 7 063 10 412 10 102 11 413 47.4Land and sub-soil assets %u2013 %u2013 %u2013 %u2013 %u2013 %u2013 %u2013 %u2013 %u2013Software and other intangible assets %u2013 %u2013 %u2013 %u2013 %u2013 %u2013 %u2013 %u2013 %u2013Payments for financial assets %u2013 %u2013 %u2013 %u2013 %u2013 %u2013 %u2013 %u2013 %u2013Total economic classification 822 566 821 864 804 884 850 065 844 665 844 665 891 436 918 554 950 997 5.52024/25Tables 18 above shows the summary of departmental payments and estimates for the Agricultural Producer Support and Development programme per economic classification from 2021/22 to 2027/28. Expenditure increased from R822.566 million in 2021/22 to a revised estimate of R844.665 million in 2024/25, due to additional funding for enhancing the livestock improvement programme around the O.R. Tambo district, as well as the construction of additional spring water sites. Furthermore, additional allocations were made towards import substitution for agricultural commodities such as soya beans, canola, sunflower, poultry, and piggery production. In 2025/26, the budget increases by 5.5 per cent to R891.436 million, owing to the reallocation of the Ilima/Letsema budget, which was reduced in 2024/25. Additionally, the department was allocated additional funding for the operationalisation of 13 custom feeding centres and the Livestock Identification and Traceability System (LITS). Compensation of employees increased from R364.572 million in 2021/22 to a revised estimate of R426.752 million in 2024/25, mainly due to decisions regarding the Extension Recovery Plan (ERP) budget, which was allocated for the recruitment of qualified extension personnel.. In 2025/26, the budget increases by 5.2 per cent to R449.090 million to cater for the filling of posts. Goods and services decreased from R267.023 million in 2021/22 to a revised estimate of R245.661 million in 2024/25, mainly due to the reduction of the Ilima/Letsema grant budget and reprioritisation of funds towards Payments for Capital Assets for the procurement of tractors and related machinery. However, the budget increases by 15.2 per cent to R283.017 million in 2025/26. This increase is attributed to the reallocation of the Ilima/Letsema budget, which was reduced in 2024/25, as well as additional allocations for custom feeding centres and the implementation of the Livestock Identification and Traceability System (LITS), including ear tags and tattooing. Transfers and subsidies increased from R31.510 million in 2021/22 to a revised estimate of R40.251 million in 2024/25, mainly due the provision to cater for the Blended Finance Scheme, RED hubs, citrus intervention, and the commodity revolving credit facility. In 2025/26, the budget increases by 6.2 per cent due to an increase in the allocation for the operationalisation of RED Hubs. Payments for capital assets decreased from R159.461 million in 2021/22 to a revised estimate of R132.001 million in 2024/25, attributed to the reprioritisation of funds for the Blended Finance Scheme. In 2025/26, the budget decreases by 11.7percent to R116.569 million, following the onceoff allocation for the procurement of tractors in 2024/25. 556
