
Page 629 - Demo
P. 629
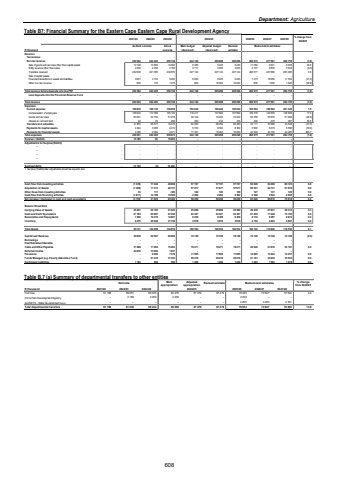
Department: AgricultureTable B7: Financial Summary for the Eastern Cape Eastern Cape Rural Development Agency 2021/22 2022/23 2023/24 2024/25 2025/26 2026/27 2027/28 % change from 2024/25R thousand Audited outcome Actual outcomeMain budget (Approved)Adjusted budget (Approved)Revised estimateRevenueTax revenue - - - - - - - - -Non-tax revenue 252 364 242 405 256 136 244 146 265 298 265 298 260 975 277 581 284 755 (1.6)Sale of goods and services other than capital assets 13 108 13 585 14 000 6 485 9 445 9 445 11 580 9 501 9 938 22.6Entity revenue other than sales 2 268 2 458 3 182 3 717 3 000 3 000 2 707 2 805 2 934 (9.8)Transfers received 232 608 221 885 232 879 227 144 227 144 227 144 238 577 247 686 253 485 5.0Sale of capital assets - - - - - - - - -Financial transactions in assets and liabilities 3 681 3 743 5 000 6 000 9 245 9 245 7 273 16 589 17 352 (21.3)Other non-tax revenue 699 733 1 075 800 16 464 16 464 838 1 000 1 046 (94.9)Total revenue before deposits into the PRF 252 364 242 405 256 136 244 146 265 298 265 298 260 975 277 581 284 755 (1.6)Less Deposits into the Provincial Revenue Fund - - - - - - - - -Total revenue 252 364 242 405 256 136 244 146 265 298 265 298 260 975 277 581 284 755 (1.6)ExpensesCurrent expense 189 945 168 143 156 654 164 839 180 422 180 422 183 064 196 564 201 346 1.5Compensation of employees 106 640 113 366 105 120 116 417 107 984 107 984 126 378 140 559 148 969 17.0Goods and services 83 281 54 752 51 278 48 122 72 222 72 222 56 356 55 635 51 990 (22.0)Interest on rent and land 24 25 256 300 216 216 330 370 387 52.8Transfers and subsidies 41 853 68 577 74 376 62 250 66 250 66 250 32 111 33 588 34 528 (51.5)Payments for capital assets 2 444 3 685 4 472 5 700 8 362 8 362 5 800 5 279 5 596 (30.6)Payments for financial assets 4 339 2 000 4 371 11 357 10 264 10 264 40 000 42 150 43 285 289.7Total expenses 238 581 242 405 239 873 244 146 265 298 265 298 260 975 277 581 284 755 (1.6)Surplus / (Deficit) 13 783 16 263 (0) - - - - - -Adjustments for Surplus/(Deficit) %u2013 - - - - - - - - - - %u2013 - - - - - - - - - - %u2013 - - - - - - - - - - %u2013 - - - - - - - - - -Surplus/(defici 13 7 - (0) 83 16 263 - - - - - - 1. Surplus/ (Deficit) after adjustments should be equal to zero.Cash flow from investing activities (1 335) 17 424 48 086 57 197 57 197 57 197 60 628 64 268 68 123 6.0Acquisition of Assets (1 368) 17 313 48 131 57 077 57 077 57 077 60 501 64 131 67 978 6.0Other flows from Investing Activities 33 111 (45) 120 120 120 127 137 145 5.8Cash flow from financing activities (1 817) 14 199 15 306 2 262 2 262 2 262 2 398 2 542 2 695 6.0Net increase / (decrease) in cash and cash equivalents (3 152) 31 623 63 392 59 459 59 459 59 459 63 026 66 810 70 818 6.0Balance Sheet DataCarrying Value of Assets 25 837 26 185 21 243 25 089 25 089 25 089 26 430 27 831 29 314 5.3Cash and Cash Equivalents 61 783 60 907 67 230 63 307 63 307 63 307 67 405 71 449 75 736 6.5Receivables and Prepayments 1 836 10 218 12 607 8 239 8 239 8 239 8 733 9 257 9 813 6.0Inventory 6 275 25 649 31 738 3 919 3 919 3 919 4 154 4 403 4 667 6.0Total Assets 95 731 122 959 132 818 100 554 100 554 100 554 106 722 112 940 119 530 6.1Capital and Reserves 52 649 62 697 92 609 72 748 72 748 72 748 72 748 72 748 72 748 (0.0)Borrowings - - - - - - - - -Post Retirement Benefits - - - - - - - - -Trade and Other Payables 31 028 11 983 15 403 19 471 19 471 19 471 20 640 21 878 23 191 6.0Deferred Income 24 832 13 004 1 837 - - - - - -Provisions 6 894 - 7 376 11 965 11 965 11 965 12 683 13 444 14 251 6.0Funds Managed (e.g. Poverty Alleviation Fund) 27 478 - 31 353 29 416 29 416 29 416 31 181 33 052 35 035 6.0Contingent Liabilities 1 192 904 500 1 408 1 408 1 408 1 493 1 583 1 678 6.0Medium-term estimatesTable B.7 (a) Summary of departmental transfers to other entities Outcome Main appropriationAdjusted appropriation Revised estimate Medium-term estimates % change from 2024/25R thousand 2021/22 2022/23 2023/24 2025/26 2026/27 2027/28Fort Cox 59 051 61 198 66 035 64 479 67 279 67 279 70 245 70 547 72 522 4.4Chris Hani Development Agency 2 189 %u2013 2 209 2 209 %u2013 %u2013 2 209 %u2013 %u2013 AgriSETA - Skills Development Levy %u2013 %u2013 %u2013 %u2013 %u2013 %u2013 4 200 4 300 4 361 Total departmental transfers 61 240 61 198 68 244 66 688 67 279 67 279 76 654 74 847 76 883 13.92024/25608
