
Page 720 - Demo
P. 720
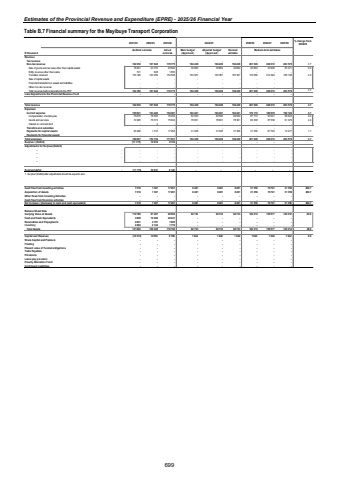
Estimates of the Provincial Revenue and Expenditure (EPRE) - 2025/26 Financial YearTable B.7 Financial summary for the Mayibuye Transport Corporation 2021/22 2022/23 2023/24 2024/25 2025/26 2026/27 2027/28 % change from 2024/25R thousand Audited outcome Actual outcomeMain budget (Approved)Adjusted budget (Approved)Revised estimateRevenueTax revenue - - - - - - - - -Non-tax revenue 162 352 167 640 179 775 194 429 194 429 194 429 201 528 248 372 203 579 3.7Sale of goods and services other than capital assets 16 461 23 733 23 592 30 862 30 862 30 862 30 862 33 948 35 471 0.0Entity revenue other than sales 701 648 1 655 - - - - - -Transfers received 145 190 143 259 154 528 163 567 163 567 163 567 170 666 214 424 168 108 4.3Sale of capital assets - - - - - - - - -Financial transactions in assets and liabilities - - - - - - - - -Other non-tax revenue - - - - - - - - -Total revenue before deposits into the PRF 162 352 167 640 179 775 194 429 194 429 194 429 201 528 248 372 203 579 3.7Less Deposits into the Provincial Revenue Fund - - - - - - - - -Total revenue 162 352 167 640 179 775 194 429 194 429 194 429 201 528 248 372 203 579 3.7ExpensesCurrent expense 150 621 153 420 154 387 163 401 163 401 163 401 170 172 180 579 190 102 4.1Compensation of employees 75 676 76 845 78 455 84 500 84 500 84 500 87 774 93 041 98 623 3.9Goods and services 74 945 76 573 75 932 78 901 78 901 78 901 82 398 87 538 91 479 4.4Interest on rent and land - 2 - - - - - - -Transfers and subsidies - - - - - - - - -Payments for capital assets 29 446 1 310 17 264 31 028 31 028 31 028 31 356 67 793 13 477 1.1Payments for financial assets - - - - - - - - -Total expenses 180 067 154 730 171 651 194 429 194 429 194 429 201 528 248 372 203 579 3.7Surplus / (Deficit) (17 715) 12 910 8 124 - - - - - -Adjustments for Surplus/(Deficit) %u2013 - - - - - - - - - - %u2013 - - - - - - - - - - %u2013 - - - - - - - - - - %u2013 - - - - - - - - - -Surplus/(defici (17 - 715) 12 910 8 124 - - - - - - 1. Surplus/ (Deficit) after adjustments should be equal to zero.Cash flow from investing activities 7 318 1 307 17 261 8 481 8 481 8 481 31 356 70 721 31 356 269.7Acquisition of Assets 7 318 1 307 17 261 8 481 8 481 8 481 31 356 70 721 31 356 269.7Other flows from Investing Activities - - - - - - - - -Cash flow from financing activities - - - - - - - - -Net increase / (decrease) in cash and cash equivalents 7 318 1 307 17 261 8 481 8 481 8 481 31 356 70 721 31 356 269.7Balance Sheet DataCarrying Value of Assets 112 788 87 287 92 054 92 733 92 733 92 733 120 212 159 577 120 212 29.6Cash and Cash Equivalents 3 809 12 206 22 441 - - - - - -Receivables and Prepayments 2 601 4 791 1 925 - - - - - -Inventory 2 484 2 144 1 776 - - - - - -Total Assets 121 682 106 428 118 196 92 733 92 733 92 733 120 212 159 577 120 212 29.6Capital and Reserves (16 073) 14 552 9 766 1 642 1 642 1 642 1 642 1 642 1 642 0.0Share Capital and Premium - - - - - - - - -Floating - - - - - - - - -Present value of Funded obligations - - - - - - - - -Trade Payables - - - - - - - - -Provisions - - - - - - - - -Leave pay provision - - - - - - - - -Poverty Alleviation Fund - - - - - - - - -Contingent Liabilities - - - - - - - - -Medium-term estimates699
