
Page 714 - Demo
P. 714
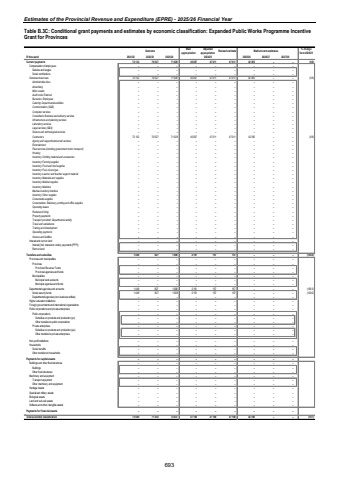
Estimates of the Provincial Revenue and Expenditure (EPRE) - 2025/26 Financial YearTable B.3C: Conditional grant payments and estimates by economic classification: Expanded Public Works Programme Incentive Grant for Provinces Outcome Main appropriationAdjusted appropriation Revised estimate Medium-term estimates % change from 2024/25R thousand 2021/22 2022/23 2023/24 2025/26 2026/27 2027/28Current payments 70 527 72 132 71 029 45 007 47 011 47 011 42 395 %u2013 %u2013 (9.8)Compensation of employees %u2013 %u2013 %u2013 %u2013 %u2013 %u2013 %u2013 %u2013 %u2013 Salaries and wages %u2013 %u2013 %u2013 %u2013 %u2013 %u2013 %u2013 %u2013 %u2013 Social contributions %u2013 %u2013 %u2013 %u2013 %u2013 %u2013 %u2013 %u2013 %u2013 Goods and services 70 527 72 132 71 029 45 007 47 011 47 011 42 395 %u2013 %u2013 (9.8)Administrative fees %u2013 %u2013 %u2013 %u2013 %u2013 %u2013 %u2013 %u2013 %u2013 Advertising %u2013 %u2013 %u2013 %u2013 %u2013 %u2013 %u2013 %u2013 %u2013 Minor assets %u2013 %u2013 %u2013 %u2013 %u2013 %u2013 %u2013 %u2013 %u2013 Audit costs: External %u2013 %u2013 %u2013 %u2013 %u2013 %u2013 %u2013 %u2013 %u2013Bursaries: Employees %u2013 %u2013 %u2013 %u2013 %u2013 %u2013 %u2013 %u2013 %u2013Catering: Departmental activities %u2013 %u2013 %u2013 %u2013 %u2013 %u2013 %u2013 %u2013 %u2013Communication (G&S) %u2013 %u2013 %u2013 %u2013 %u2013 %u2013 %u2013 %u2013 %u2013Computer services %u2013 %u2013 %u2013 %u2013 %u2013 %u2013 %u2013 %u2013 %u2013Consultants: Business and advisory services %u2013 %u2013 %u2013 %u2013 %u2013 %u2013 %u2013 %u2013 %u2013Infrastructure and planning services %u2013 %u2013 %u2013 %u2013 %u2013 %u2013 %u2013 %u2013 %u2013Laboratory services %u2013 %u2013 %u2013 %u2013 %u2013 %u2013 %u2013 %u2013 %u2013Legal services (G&S) %u2013 %u2013 %u2013 %u2013 %u2013 %u2013 %u2013 %u2013 %u2013Science and technological services %u2013 %u2013 %u2013 %u2013 %u2013 %u2013 %u2013 %u2013 %u2013Contractors 72 132 70 527 71 029 45 007 47 011 47 011 42 395 %u2013 %u2013 (9.8)Agency and support/outsourced services %u2013 %u2013 %u2013 %u2013 %u2013 %u2013 %u2013 %u2013 %u2013Entertainment %u2013 %u2013 %u2013 %u2013 %u2013 %u2013 %u2013 %u2013 %u2013Fleet services (including government motor transport) %u2013 %u2013 %u2013 %u2013 %u2013 %u2013 %u2013 %u2013 %u2013Housing %u2013 %u2013 %u2013 %u2013 %u2013 %u2013 %u2013 %u2013 %u2013Inventory: Clothing material and accessories %u2013 %u2013 %u2013 %u2013 %u2013 %u2013 %u2013 %u2013 %u2013Inventory: Farming supplies %u2013 %u2013 %u2013 %u2013 %u2013 %u2013 %u2013 %u2013 %u2013Inventory: Food and food supplies %u2013 %u2013 %u2013 %u2013 %u2013 %u2013 %u2013 %u2013 %u2013Inventory: Fuel, oil and gas %u2013 %u2013 %u2013 %u2013 %u2013 %u2013 %u2013 %u2013 %u2013Inventory: Learner and teacher support material %u2013 %u2013 %u2013 %u2013 %u2013 %u2013 %u2013 %u2013 %u2013Inventory: Materials and supplies %u2013 %u2013 %u2013 %u2013 %u2013 %u2013 %u2013 %u2013 %u2013Inventory: Medical supplies %u2013 %u2013 %u2013 %u2013 %u2013 %u2013 %u2013 %u2013 %u2013Inventory: Medicine %u2013 %u2013 %u2013 %u2013 %u2013 %u2013 %u2013 %u2013 %u2013Medsas inventory interface %u2013 %u2013 %u2013 %u2013 %u2013 %u2013 %u2013 %u2013 %u2013Inventory: Other supplies %u2013 %u2013 %u2013 %u2013 %u2013 %u2013 %u2013 %u2013 %u2013Consumable supplies %u2013 %u2013 %u2013 %u2013 %u2013 %u2013 %u2013 %u2013 %u2013Consumables: Stationery, printing and office supplies %u2013 %u2013 %u2013 %u2013 %u2013 %u2013 %u2013 %u2013 %u2013Operating leases %u2013 %u2013 %u2013 %u2013 %u2013 %u2013 %u2013 %u2013 %u2013Rental and hiring %u2013 %u2013 %u2013 %u2013 %u2013 %u2013 %u2013 %u2013 %u2013Property payments %u2013 %u2013 %u2013 %u2013 %u2013 %u2013 %u2013 %u2013 %u2013Transport provided: Departmental activity %u2013 %u2013 %u2013 %u2013 %u2013 %u2013 %u2013 %u2013 %u2013Travel and subsistence %u2013 %u2013 %u2013 %u2013 %u2013 %u2013 %u2013 %u2013 %u2013Training and development %u2013 %u2013 %u2013 %u2013 %u2013 %u2013 %u2013 %u2013 %u2013Operating payments %u2013 %u2013 %u2013 %u2013 %u2013 %u2013 %u2013 %u2013 %u2013Venues and facilities %u2013 %u2013 %u2013 %u2013 %u2013 %u2013 %u2013 %u2013 %u2013Interest and rent on land %u2013 %u2013 %u2013 %u2013 %u2013 %u2013 %u2013 %u2013 %u2013Interest (Incl. interest on unitary payments (PPP)) %u2013 %u2013 %u2013 %u2013 %u2013 %u2013 %u2013 %u2013 %u2013Rent on land %u2013 %u2013 %u2013 %u2013 %u2013 %u2013 %u2013 %u2013 %u2013Transfers and subsidies 1 448 827 1 008 2 161 157 157 %u2013 %u2013 %u2013 (100.0)Provinces and municipalities %u2013 %u2013 %u2013 %u2013 %u2013 %u2013 %u2013 %u2013 %u2013Provinces %u2013 %u2013 %u2013 %u2013 %u2013 %u2013 %u2013 %u2013 %u2013Provincial Revenue Funds %u2013 %u2013 %u2013 %u2013 %u2013 %u2013 %u2013 %u2013 %u2013Provincial agencies and funds %u2013 %u2013 %u2013 %u2013 %u2013 %u2013 %u2013 %u2013 %u2013Municipalities %u2013 %u2013 %u2013 %u2013 %u2013 %u2013 %u2013 %u2013 %u2013Municipal bank accounts %u2013 %u2013 %u2013 %u2013 %u2013 %u2013 %u2013 %u2013 %u2013Municipal agencies and funds %u2013 %u2013 %u2013 %u2013 %u2013 %u2013 %u2013 %u2013 %u2013Departmental agencies and accounts 1 448 827 1 008 2 161 157 157 %u2013 %u2013 %u2013 (100.0)Social security funds 1 448 827 1 008 2 161 157 157 %u2013 %u2013 %u2013 (100.0)Departmental agencies (non-business entities) %u2013 %u2013 %u2013 %u2013 %u2013 %u2013 %u2013 %u2013 %u2013Higher education institutions %u2013 %u2013 %u2013 %u2013 %u2013 %u2013 %u2013 %u2013 %u2013Foreign governments and international organisations %u2013 %u2013 %u2013 %u2013 %u2013 %u2013 %u2013 %u2013 %u2013Public corporations and private enterprises %u2013 %u2013 %u2013 %u2013 %u2013 %u2013 %u2013 %u2013 %u2013Public corporations %u2013 %u2013 %u2013 %u2013 %u2013 %u2013 %u2013 %u2013 %u2013Subsidies on products and production (pc) %u2013 %u2013 %u2013 %u2013 %u2013 %u2013 %u2013 %u2013 %u2013Other transfers to public corporations %u2013 %u2013 %u2013 %u2013 %u2013 %u2013 %u2013 %u2013 %u2013Private enterprises %u2013 %u2013 %u2013 %u2013 %u2013 %u2013 %u2013 %u2013 %u2013Subsidies on products and production (pe) %u2013 %u2013 %u2013 %u2013 %u2013 %u2013 %u2013 %u2013 %u2013Other transfers to private enterprises %u2013 %u2013 %u2013 %u2013 %u2013 %u2013 %u2013 %u2013 %u2013Non-profit institutions %u2013 %u2013 %u2013 %u2013 %u2013 %u2013 %u2013 %u2013 %u2013Households %u2013 %u2013 %u2013 %u2013 %u2013 %u2013 %u2013 %u2013 %u2013Social benefits %u2013 %u2013 %u2013 %u2013 %u2013 %u2013 %u2013 %u2013 %u2013Other transfers to households %u2013 %u2013 %u2013 %u2013 %u2013 %u2013 %u2013 %u2013 %u2013Payments for capital assets %u2013 %u2013 %u2013 %u2013 %u2013 %u2013 %u2013 %u2013 %u2013Buildings and other fixed structures %u2013 %u2013 %u2013 %u2013 %u2013 %u2013 %u2013 %u2013 %u2013Buildings %u2013 %u2013 %u2013 %u2013 %u2013 %u2013 %u2013 %u2013 %u2013Other fixed structures %u2013 %u2013 %u2013 %u2013 %u2013 %u2013 %u2013 %u2013 %u2013Machinery and equipment %u2013 %u2013 %u2013 %u2013 %u2013 %u2013 %u2013 %u2013 %u2013Transport equipment %u2013 %u2013 %u2013 %u2013 %u2013 %u2013 %u2013 %u2013 %u2013Other machinery and equipment %u2013 %u2013 %u2013 %u2013 %u2013 %u2013 %u2013 %u2013 %u2013Heritage Assets %u2013 %u2013 %u2013 %u2013 %u2013 %u2013 %u2013 %u2013 %u2013Specialised military assets %u2013 %u2013 %u2013 %u2013 %u2013 %u2013 %u2013 %u2013 %u2013Biological assets %u2013 %u2013 %u2013 %u2013 %u2013 %u2013 %u2013 %u2013 %u2013Land and sub-soil assets %u2013 %u2013 %u2013 %u2013 %u2013 %u2013 %u2013 %u2013 %u2013Software and other intangible assets %u2013 %u2013 %u2013 %u2013 %u2013 %u2013 %u2013 %u2013 %u2013Payments for financial assets %u2013 %u2013 %u2013 %u2013 %u2013 %u2013 %u2013 %u2013 %u2013Total economic classification 73 580 71 354 72 037 47 168 47 168 47 168 42 395 %u2013 %u2013 (10.1)2024/25693
