
Page 805 - Demo
P. 805
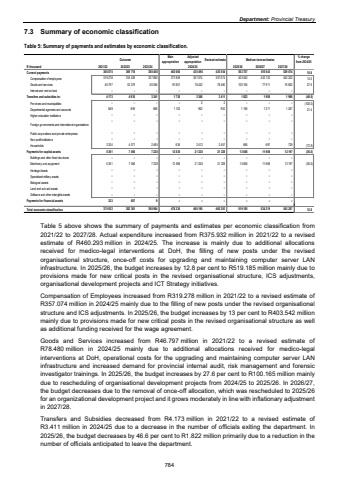
Department: Provincial Treasury 7.3 Summary of economic classification Table 5: Summary of payments and estimates by economic classification. Outcome Main appropriationAdjusted appropriation Revised estimate Medium-term estimates % change from 2024/25R thousand 2021/22 2022/23 2023/24 2025/26 2026/27 2027/28Current payments 369 718 366 075 388 406 463 660 435 496 435 554 503 707 510 643 529 074 15.6Compensation of employees 316 439 319 278 327 850 371 859 357 074 357 074 403 542 432 732 452 222 13.0Goods and services 53 279 46 797 60 556 91 801 78 422 78 480 100 165 77 911 76 852 27.6Interest and rent on land %u2013 %u2013 %u2013 %u2013 %u2013 %u2013 %u2013 %u2013 %u2013 Transfers and subsidies to: 4 930 4 173 3 341 1 738 3 366 3 411 1 822 1 908 1 996 (46.6)Provinces and municipalities %u2013 %u2013 %u2013 %u2013 2 2 %u2013 %u2013 %u2013 (100.0)Departmental agencies and accounts 859 849 856 1 102 952 952 1 156 1 211 1 267 21.4Higher education institutions %u2013 %u2013 %u2013 %u2013 %u2013 %u2013 %u2013 %u2013 %u2013Foreign governments and international organisations %u2013 %u2013 %u2013 %u2013 %u2013 %u2013 %u2013 %u2013 %u2013Public corporations and private enterprises %u2013 %u2013 %u2013 %u2013 %u2013 %u2013 %u2013 %u2013 %u2013Non-profit institutions %u2013 %u2013 %u2013 %u2013 %u2013 %u2013 %u2013 %u2013 %u2013Households 3 324 4 071 2 485 636 2 412 2 457 666 697 729 (72.9)Payments for capital assets 5 361 7 056 7 228 12 838 21 328 21 328 13 656 11 668 12 197 (36.0)Buildings and other fixed structures %u2013 %u2013 %u2013 %u2013 %u2013 %u2013 %u2013 %u2013 %u2013Machinery and equipment 5 361 7 056 7 228 12 838 21 328 21 328 13 656 11 668 12 197 (36.0)Heritage Assets %u2013 %u2013 %u2013 %u2013 %u2013 %u2013 %u2013 %u2013 %u2013Specialised military assets %u2013 %u2013 %u2013 %u2013 %u2013 %u2013 %u2013 %u2013 %u2013Biological assets %u2013 %u2013 %u2013 %u2013 %u2013 %u2013 %u2013 %u2013 %u2013Land and sub-soil assets %u2013 %u2013 %u2013 %u2013 %u2013 %u2013 %u2013 %u2013 %u2013Software and other intangible assets %u2013 %u2013 %u2013 %u2013 %u2013 %u2013 %u2013 %u2013 %u2013Payments for financial assets 323 657 9 %u2013 %u2013 %u2013 %u2013 %u2013 %u2013Total economic classification 375 932 382 361 398 984 478 236 460 190 460 293 519 185 524 219 543 267 12.82024/25Table 5 above shows the summary of payments and estimates per economic classification from 2021/22 to 2027/28. Actual expenditure increased from R375.932 million in 2021/22 to a revised estimate of R460.293 million in 2024/25. The increase is mainly due to additional allocations received for medico-legal interventions at DoH, the filling of new posts under the revised organisational structure, once-off costs for upgrading and maintaining computer server LAN infrastructure. In 2025/26, the budget increases by 12.8 per cent to R519.185 million mainly due to provisions made for new critical posts in the revised organisational structure, ICS adjustments, organisational development projects and ICT Strategy initiatives. Compensation of Employees increased from R319.278 million in 2021/22 to a revised estimate of R357.074 million in 2024/25 mainly due to the filling of new posts under the revised organisational structure and ICS adjustments. In 2025/26, the budget increases by 13 per cent to R403.542 million mainly due to provisions made for new critical posts in the revised organisational structure as well as additional funding received for the wage agreement. Goods and Services increased from R46.797 million in 2021/22 to a revised estimate of R78.480 million in 2024/25 mainly due to additional allocations received for medico-legal interventions at DoH, operational costs for the upgrading and maintaining computer server LAN infrastructure and increased demand for provincial internal audit, risk management and forensic investigator trainings. In 2025/26, the budget increases by 27.6 per cent to R100.165 million mainly due to rescheduling of organisational development projects from 2024/25 to 2025/26. In 2026/27, the budget decreases due to the removal of once-off allocation, which was rescheduled to 2025/26 for an organizational development project and it grows moderately in line with inflationary adjustment in 2027/28. Transfers and Subsidies decreased from R4.173 million in 2021/22 to a revised estimate of R3.411 million in 2024/25 due to a decrease in the number of officials exiting the department. In 2025/26, the budget decreases by 46.6 per cent to R1.822 million primarily due to a reduction in the number of officials anticipated to leave the department. 784
