
Page 809 - Demo
P. 809
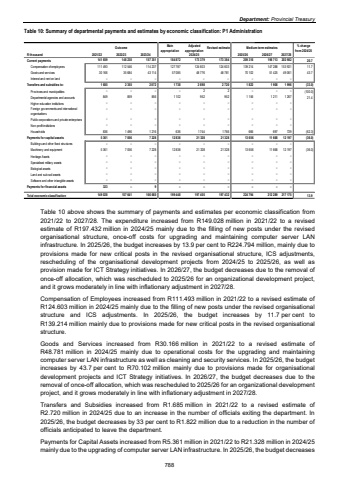
Department: Provincial Treasury Table 10: Summary of departmental payments and estimates by economic classification: P1 Administration Outcome Main appropriationAdjusted appropriation Revised estimate Medium-term estimates % change from 2024/25R thousand 2021/22 2022/23 2023/24 2025/26 2026/27 2027/28Current payments 141 659 148 230 157 351 184 872 173 379 173 384 209 316 202 982 198 713 20.7Compensation of employees 111 493 112 546 114 237 127 787 124 603 124 603 139 214 153 921 147 288 11.7Goods and services 30 166 35 684 43 114 57 085 48 776 48 781 70 102 49 061 51 425 43.7Interest and rent on land %u2013 %u2013 %u2013 %u2013 %u2013 %u2013 %u2013 %u2013 %u2013Transfers and subsidies to: 1 685 2 355 2 072 1 738 2 698 2 720 1 822 1 996 1 908 (33.0)Provinces and municipalities %u2013 %u2013 %u2013 %u2013 2 2 %u2013 %u2013 %u2013 (100.0)Departmental agencies and accounts 849 859 856 1 102 952 952 1 156 1 267 1 211 21.4Higher education institutions %u2013 %u2013 %u2013 %u2013 %u2013 %u2013 %u2013 %u2013 %u2013Foreign governments and international organisations %u2013 %u2013 %u2013 %u2013 %u2013 %u2013 %u2013 %u2013 %u2013Public corporations and private enterprises %u2013 %u2013 %u2013 %u2013 %u2013 %u2013 %u2013 %u2013 %u2013Non-profit institutions %u2013 %u2013 %u2013 %u2013 %u2013 %u2013 %u2013 %u2013 %u2013Households 836 1 496 1 216 636 1 744 1 766 666 729 697 (62.3)Payments for capital assets 5 361 7 056 7 228 12 838 21 328 21 328 13 656 12 197 11 668 (36.0)Buildings and other fixed structures %u2013 %u2013 %u2013 %u2013 %u2013 %u2013 %u2013 %u2013 %u2013Machinery and equipment 5 361 7 056 7 228 12 838 21 328 21 328 13 656 12 197 11 668 (36.0)Heritage Assets %u2013 %u2013 %u2013 %u2013 %u2013 %u2013 %u2013 %u2013 %u2013Specialised military assets %u2013 %u2013 %u2013 %u2013 %u2013 %u2013 %u2013 %u2013 %u2013Biological assets %u2013 %u2013 %u2013 %u2013 %u2013 %u2013 %u2013 %u2013 %u2013Land and sub-soil assets %u2013 %u2013 %u2013 %u2013 %u2013 %u2013 %u2013 %u2013 %u2013Software and other intangible assets %u2013 %u2013 %u2013 %u2013 %u2013 %u2013 %u2013 %u2013 %u2013Payments for financial assets 323 %u2013 9 %u2013 %u2013 %u2013 %u2013 %u2013 %u2013Total economic classification 149 028 157 641 166 660 199 448 197 405 197 432 224 794 217 175 212 289 13.92024/25Table 10 above shows the summary of payments and estimates per economic classification from 2021/22 to 2027/28. The expenditure increased from R149.028 million in 2021/22 to a revised estimate of R197.432 million in 2024/25 mainly due to the filling of new posts under the revised organisational structure, once-off costs for upgrading and maintaining computer server LAN infrastructure. In 2025/26, the budget increases by 13.9 per cent to R224.794 million, mainly due to provisions made for new critical posts in the revised organisational structure, ICS adjustments, rescheduling of the organisational development projects from 2024/25 to 2025/26, as well as provision made for ICT Strategy initiatives. In 2026/27, the budget decreases due to the removal of once-off allocation, which was rescheduled to 2025/26 for an organizational development project, and it grows moderately in line with inflationary adjustment in 2027/28. Compensation of Employees increased from R111.493 million in 2021/22 to a revised estimate of R124.603 million in 2024/25 mainly due to the filling of new posts under the revised organisational structure and ICS adjustments. In 2025/26, the budget increases by 11.7 per cent to R139.214 million mainly due to provisions made for new critical posts in the revised organisational structure. Goods and Services increased from R30.166 million in 2021/22 to a revised estimate of R48.781 million in 2024/25 mainly due to operational costs for the upgrading and maintaining computer server LAN infrastructure as well as cleaning and security services. In 2025/26, the budget increases by 43.7 per cent to R70.102 million mainly due to provisions made for organisational development projects and ICT Strategy initiatives. In 2026/27, the budget decreases due to the removal of once-off allocation, which was rescheduled to 2025/26 for an organizational development project, and it grows moderately in line with inflationary adjustment in 2027/28. Transfers and Subsidies increased from R1.685 million in 2021/22 to a revised estimate of R2.720 million in 2024/25 due to an increase in the number of officials exiting the department. In 2025/26, the budget decreases by 33 per cent to R1.822 million due to a reduction in the number of officials anticipated to leave the department. Payments for Capital Assets increased from R5.361 million in 2021/22 to R21.328 million in 2024/25 mainly due to the upgrading of computer server LAN infrastructure. In 2025/26, the budget decreases 788
