
Page 844 - Demo
P. 844
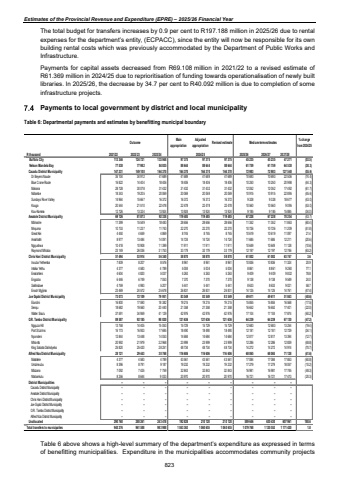
Estimates of the Provincial Revenue and Expenditure (EPRE) %u2013 2025/26 Financial YearThe total budget for transfers increases by 0.9 per cent to R197.188 million in 2025/26 due to rental expenses for the department%u2019s entity, (ECPACC), since the entity will now be responsible for its own building rental costs which was previously accommodated by the Department of Public Works and Infrastructure. Payments for capital assets decreased from R69.108 million in 2021/22 to a revised estimate of R61.369 million in 2024/25 due to reprioritisation of funding towards operationalisation of newly built libraries. In 2025/26, the decrease by 34.7 per cent to R40.092 million is due to completion of some infrastructure projects. Payments to local government by district and local municipality Table 6: Departmental payments and estimates by benefitting municipal boundary Outcome Main appropriationAdjusted appropriation Revised estimate Medium-term estimates % change from 2024/25R thousand 2021/22 2022/23 2023/24 2025/26 2026/27 2027/28 Buffalo City 113 346 124 721 133 948 97 375 97 375 97 375 45 235 45 235 47 271 (53.5) Nelson Mandela Bay 77 538 77 982 84 835 88 644 88 644 88 644 61 759 61 759 64 538 (30.3)Cacadu District Municipality 147 231 149 100 164 370 164 370 164 370 164 370 72 983 72 983 127 548 (55.6) Dr Beyers Naude 35 104 34 912 41 689 41 689 41 689 41 689 10 693 10 693 22 506 (74.4) Blue Crane Route 16 822 14 404 18 406 18 406 18 406 18 406 10 250 10 250 20 998 (44.3) Makana 28 728 30 078 31 432 31 432 31 432 31 432 12 052 12 052 17 492 (61.7) Ndlambe 18 343 19 205 20 069 20 069 20 069 20 069 10 915 10 915 22 895 (45.6) Sundays River Valley 14 964 15 667 16 372 16 372 16 372 16 372 9 328 9 328 18 677 (43.0) Kouga 20 544 21 510 22 478 22 478 22 478 22 478 10 560 10 560 9 095 (53.0) Kou-Kamma 12 726 13 324 13 924 13 924 13 924 13 924 9 185 15 885 9 185 (34.0)Amatole District Municipality 69 126 81 873 92 338 119 485 119 485 119 485 67 228 67 228 70 254 (43.7) Mbhashe 11 399 15 549 18 483 28 656 28 656 28 656 11 352 11 352 11 863 (60.4) Mnquma 10 733 11 237 11 743 22 270 22 270 22 270 10 726 10 726 11 209 (51.8) Great Kei 4 450 4 659 4 869 8 745 8 745 8 745 10 619 10 619 11 097 21.4 Amahlathi 8 977 13 484 14 091 14 724 14 724 14 724 11 685 11 685 12 211 (20.6) Ngqushwa 10 418 10 908 11 399 11 911 11 911 11 911 10 649 10 649 11 128 (10.6) Raymond Mhlaba 23 149 26 036 31 753 33 179 33 179 33 179 12 197 12 197 12 746 (63.2)Chris Hani District Municipality 51 494 53 914 56 340 58 870 58 870 58 870 61 002 61 002 63 747 3.6 Inxuba Yethemba 7 839 8 207 8 576 8 961 8 961 8 961 10 836 10 836 11 324 20.9 Intsika Yethu 4 377 4 583 4 789 5 004 5 004 5 004 8 861 8 861 9 260 77.1 Emalahleni 4 604 4 820 5 037 5 263 5 263 5 263 9 409 9 409 9 832 78.8 Engcobo 6 446 6 749 7 053 7 370 7 370 7 370 9 138 9 138 9 549 24.0 Sakhisizwe 4 759 4 983 5 207 5 441 5 441 5 441 8 633 8 633 9 021 58.7 Enoch Mgijima 23 469 24 572 25 678 26 831 26 831 26 831 14 125 14 125 14 761 (47.4)Joe Gqabi District Municipality 73 073 72 109 79 951 83 549 83 549 83 549 49 611 49 611 51 843 (40.6) Elundini 16 800 17 590 18 382 19 215 19 215 19 215 15 855 15 855 16 568 (17.5) Senqu 18 682 19 560 20 440 21 358 21 358 21 358 16 652 16 652 17 401 (22.0) Walter Sisulu 37 591 34 959 41 129 42 976 42 976 42 976 17 104 17 104 17 874 (60.2)O.R. Tambo District Municipality 89 587 92 185 98 020 121 636 121 636 121 636 64 239 64 239 67 130 (47.2) Ngquza Hill 13 758 14 405 15 053 15 729 15 729 15 729 12 683 12 683 13 254 (19.4) Port St Johns 16 173 16 933 17 695 18 490 18 490 18 490 12 181 12 181 12 729 (34.1) Nyandeni 12 844 13 448 14 053 14 684 14 684 14 684 12 817 12 817 13 394 (12.7) Mhlontlo 20 992 21 979 22 968 23 999 23 999 23 999 12 286 12 286 12 839 (48.8) King Sabata Dalindyebo 25 820 25 420 28 251 48 734 48 734 48 734 14 272 14 272 14 914 (70.7)Alfred Nzo District Municipality 28 121 29 443 30 768 116 606 116 606 116 606 68 065 68 065 71 128 (41.6) Matatiele 4 377 4 583 4 789 43 561 43 561 43 561 17 084 17 084 17 853 (60.8) Umzimvubu 8 396 8 791 9 187 19 232 19 232 19 232 17 279 17 279 18 057 (10.2) Mbizana 7 092 7 425 7 759 32 843 32 843 32 843 16 981 16 981 17 745 (48.3) Ntabankulu 8 256 8 644 9 033 20 970 20 970 20 970 16 721 16 721 17 473 (20.3)District Municipalities %u2013 %u2013 %u2013 %u2013 %u2013 %u2013 %u2013 %u2013 %u2013 Cacadu District Municipality %u2013 %u2013 %u2013 %u2013 %u2013 %u2013 %u2013 %u2013 %u2013 Amatole District Municipality %u2013 %u2013 %u2013 %u2013 %u2013 %u2013 %u2013 %u2013 %u2013 Chris Hani District Municipality %u2013 %u2013 %u2013 %u2013 %u2013 %u2013 %u2013 %u2013 %u2013 Joe Gqabi District Municipality %u2013 %u2013 %u2013 %u2013 %u2013 %u2013 %u2013 %u2013 %u2013 O.R. Tambo District Municipality %u2013 %u2013 %u2013 %u2013 %u2013 %u2013 %u2013 %u2013 %u2013 Alfred Nzo District Municipality %u2013 %u2013 %u2013 %u2013 %u2013 %u2013 %u2013 %u2013 %u2013 Unallocated 290 760 280 261 243 418 192 828 210 120 210 120 589 646 630 430 607 961 180.6Total transfers to municipalies 940 276 961 588 983 988 1 043 363 1 060 655 1 060 655 1 079 768 1 120 552 1 171 420 1.82024/25Table 6 above shows a high-level summary of the department%u2019s expenditure as expressed in terms of benefitting municipalities. Expenditure in the municipalities accommodates community projects 823
