
Page 846 - Demo
P. 846
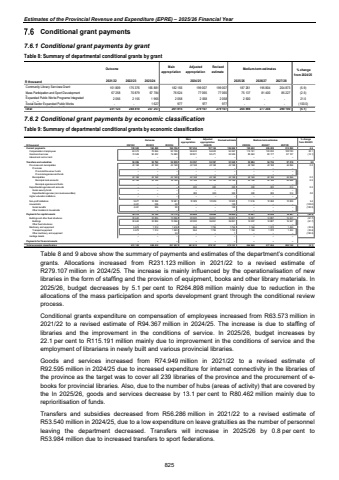
Estimates of the Provincial Revenue and Expenditure (EPRE) %u2013 2025/26 Financial Year Conditional grant payments 7.6.1 Conditional grant payments by grant Table 8: Summary of departmental conditional grants by grant Outcome Mainappropriation Adjusted appropriation Revised estimate 2021/22 2022/23 2023/24 2024/25 2025/26 2026/27 2027/28 161 809 175 376 165 881 182 156 199 007 199 007 187 261 195 804 204 873 (5.9) 67 258 70 879 67 784 76 624 77 065 77 065 75 137 81 400 85 227 (2.5) 2 056 2 155 1 965 2 058 2 058 2 058 2 500 - 21.5 - - 1 627 977 - 977 977 - - (100.0) - 231 123 248 410 237 257 261 815 279 107 279 107 264 898 277 204 290 100 (5.1)Medium-term estimates Community Library Services Grant Mass Participation and Sport Development G Expanded Public Works Programe Integrated G fP i Social Sector Expanded Public Works P I i G fP i Total % change from 2024/25 R thousand7.6.2 Conditional grant payments by economic classification Table 9: Summary of departmental conditional grants by economic classification Outcome Main appropriationAdjusted appropriation Revised estimate Medium-term estimates % change from 2024/25R thousand 2021/22 2022/23 2023/24 2025/26 2026/27 2027/28Current payments 160 498 138 522 169 706 187 454 187 104 186 962 195 653 206 209 215 890 4.6Compensation of employees 63 573 70 066 92 726 96 633 94 633 94 367 115 191 123 032 128 783 22.1Goods and services 74 949 90 432 76 980 90 821 92 471 92 595 80 462 83 177 87 107 (13.1)Interest and rent on land %u2013 %u2013 %u2013 %u2013 %u2013 %u2013 %u2013 %u2013 %u2013Transfers and subsidies 56 286 52 792 52 839 53 397 53 397 53 540 53 984 54 736 57 219 0.8 Provinces and municipalities 42 168 42 168 42 168 42 168 42 168 42 168 42 168 42 168 44 066 0.0Provinces %u2013 %u2013 %u2013 %u2013 %u2013 %u2013 %u2013 %u2013 %u2013Provincial Revenue Funds %u2013 %u2013 %u2013 %u2013 %u2013 %u2013 %u2013 %u2013 %u2013Provincial agencies and funds %u2013 %u2013 %u2013 %u2013 %u2013 %u2013 %u2013 %u2013 %u2013Municipalities 42 168 42 168 42 168 42 168 42 168 42 168 42 168 42 168 44 066 0.0Municipal bank accounts 42 168 42 168 42 168 42 168 42 168 42 168 42 168 42 168 44 066 0.0Municipal agencies and funds %u2013 %u2013 %u2013 %u2013 %u2013 %u2013 %u2013 %u2013 %u2013Departmental agencies and accounts %u2013 %u2013 %u2013 300 300 300 300 300 314 0.0Social security funds %u2013 %u2013 %u2013 %u2013 %u2013 %u2013 %u2013 %u2013 %u2013Departmental agencies (non-business entities) %u2013 %u2013 %u2013 300 300 300 300 300 314 0.0Higher education institutions %u2013 %u2013 %u2013 %u2013 %u2013 %u2013 %u2013 %u2013 %u2013Non-profit institutions 9 677 10 298 10 581 10 929 10 929 10 923 11 516 12 268 12 839 5.4Households 4 441 326 90 %u2013 %u2013 149 %u2013 %u2013 %u2013 (100.0)Social benefits 4 441 326 90 %u2013 %u2013 149 %u2013 %u2013 %u2013 (100.0)Other transfers to households %u2013 %u2013 %u2013 %u2013 %u2013 %u2013 %u2013 %u2013 %u2013Payments for capital assets 36 315 35 120 14 712 20 964 38 606 38 605 15 261 16 259 16 991 (60.5)Buildings and other fixed structures 30 642 33 806 13 096 20 000 36 851 36 851 14 097 14 887 15 557 (61.7)Buildings 30 642 33 806 13 096 20 000 36 851 36 851 14 097 14 887 15 557 (61.7)Other fixed structures %u2013 %u2013 %u2013 %u2013 %u2013 %u2013 %u2013 %u2013 %u2013Machinery and equipment 5 673 1 314 1 616 964 1 755 1 754 1 164 1 372 1 434 (33.6)Transport equipment 5 673 1 314 1 563 964 1 755 1 753 1 164 1 372 1 434 (33.6)Other machinery and equipment %u2013 %u2013 53 %u2013 %u2013 1 %u2013 %u2013 %u2013 (100.0)Heritage Assets %u2013 %u2013 %u2013 %u2013 %u2013 %u2013 %u2013 %u2013 %u2013Payments for financial assets %u2013 %u2013 %u2013 %u2013 %u2013 %u2013 %u2013 %u2013 %u2013Total economic classification 231 123 248 410 237 257 261 815 279 107 279 107 264 898 277 204 290 100 (5.1)2024/25Table 8 and 9 above show the summary of payments and estimates of the department%u2019s conditional grants. Allocations increased from R231.123 million in 2021/22 to a revised estimate of R279.107 million in 2024/25. The increase is mainly influenced by the operationalisation of new libraries in the form of staffing and the provision of equipment, books and other library materials. In 2025/26, budget decreases by 5.1 per cent to R264.898 million mainly due to reduction in the allocations of the mass participation and sports development grant through the conditional review process. Conditional grants expenditure on compensation of employees increased from R63.573 million in 2021/22 to a revised estimate of R94.367 million in 2024/25. The increase is due to staffing of libraries and the improvement in the conditions of service. In 2025/26, budget increases by 22.1 per cent to R115.191 million mainly due to improvement in the conditions of service and the employment of librarians in newly built and various provincial libraries. Goods and services increased from R74.949 million in 2021/22 to a revised estimate of R92.595 million in 2024/25 due to increased expenditure for internet connectivity in the libraries of the province as the target was to cover all 239 libraries of the province and the procurement of ebooks for provincial libraries. Also, due to the number of hubs (areas of activity) that are covered by the In 2025/26, goods and services decrease by 13.1 per cent to R80.462 million mainly due to reprioritisation of funds. Transfers and subsidies decreased from R56.286 million in 2021/22 to a revised estimate of R53.540 million in 2024/25, due to a low expenditure on leave gratuities as the number of personnel leaving the department decreased. Transfers will increase in 2025/26 by 0.8 per cent to R53.984 million due to increased transfers to sport federations. 825
