
Page 858 - Demo
P. 858
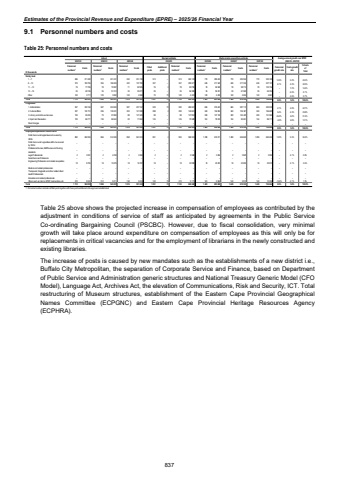
Estimates of the Provincial Revenue and Expenditure (EPRE) %u2013 2025/26 Financial Year9.1 Personnel numbers and costs Table 25: Personnel numbers and costs Actual Revised estimate Medium-term expenditure estimateR thousandsPersonnel numbers1 Costs Personnel numbers1 Costs Personnel numbers1 Costs Filled postsAdditional postsPersonnel numbers1 Costs Personnel numbers1 Costs Personnel numbers1 Costs Personnel numbers1 Costs Personnel growth rate Costs growth rate % Costs of Total Salary level1 %u2013 7 486 211 482 510 241 431 450 251 190 513 %u2013 513 262 128 770 285 422 770 292 044 770 305 189 14.5% 5.2% 43.3%8 %u2013 10 373 183 765 355 166 929 322 197 789 357 %u2013 357 200 677 426 211 520 426 217 332 426 227 107 6.1% 4.2% 32.5%11 %u2013 12 78 77 785 78 79 987 71 82 926 76 2 78 83 735 78 94 926 78 98 712 78 103 154 %u2013 7.2% 14.4%13 %u2013 16 35 48 106 35 51 212 35 55 271 35 %u2013 35 54 059 35 59 331 35 61 582 35 64 353 %u2013 6.0% 9.1%Other 140 3 717 120 3 892 140 4 066 70 70 140 4 249 140 4 499 140 4 652 140 4 861 %u2013 4.6% 0.7%Total 1 112 524 855 1 098 543 451 1 018 591 242 1 051 72 1 123 604 848 1 449 655 698 1 449 674 322 1 449 704 664 8.9% 5.2% 100.0%Programme1. Administration 597 232 166 587 243 693 587 257 167 520 70 590 260 637 665 275 423 665 287 115 665 300 035 4.1% 4.8% 42.7%2. Cultural Affairs 297 130 714 296 135 231 303 141 098 288 2 290 146 551 340 154 852 340 159 321 340 166 489 5.4% 4.3% 23.8%3. Library and Archives Services 109 95 204 79 97 883 88 121 325 98 %u2013 98 127 052 300 147 190 300 145 425 300 151 969 45.2% 6.2% 21.4%4. Sport and Recreation 109 66 771 136 66 644 40 71 652 145 %u2013 145 70 608 144 78 233 144 82 461 144 86 171 -0.2% 6.9% 12.1%Direct char ges %u2013 %u2013 %u2013 %u2013 %u2013 %u2013 %u2013 %u2013 %u2013 %u2013 %u2013 %u2013 %u2013 %u2013 %u2013 %u2013 %u2013 %u2013 %u2013Total 1 112 524 855 1 098 543 451 1 018 591 242 1 051 72 1 123 604 848 1 449 655 698 1 449 674 322 1 449 704 664 8.9% 5.2% 100.0%Employee dispensation classificationPublic Service Act appointees not covered by OSDs 882 504 959 866 514 026 858 561 618 891 2 893 569 933 1 289 619 217 1 289 636 600 1 289 665 244 13.0% 5.3% 94.4%Public Service Act appointees still to be covered by OSDs %u2013 %u2013 %u2013 %u2013 %u2013 %u2013 %u2013 %u2013 %u2013 %u2013 %u2013 %u2013 %u2013 %u2013 %u2013 %u2013 %u2013 %u2013 %u2013Professional Nurses, Staff Nurses and Nursing Assistants %u2013 %u2013 %u2013 %u2013 %u2013 %u2013 %u2013 %u2013 %u2013 %u2013 %u2013 %u2013 %u2013 %u2013 %u2013 %u2013 %u2013 %u2013 %u2013Legal Professionals 2 3 091 2 4 238 4 3 384 2 %u2013 2 3 536 2 3 694 2 3 820 2 3 992 %u2013 4.1% 0.6%Social Services Professions %u2013 %u2013 %u2013 %u2013 %u2013 %u2013 %u2013 %u2013 %u2013 %u2013 %u2013 %u2013 %u2013 %u2013 %u2013 %u2013 %u2013 %u2013 %u2013Engineering Professions and related occupations 18 8 783 18 15 976 18 16 787 18 %u2013 18 22 208 18 23 203 18 23 992 18 25 072 %u2013 4.1% 3.6%Medical and r elated pr ofessionals %u2013 %u2013 %u2013 %u2013 %u2013 %u2013 %u2013 %u2013 %u2013 %u2013 %u2013 %u2013 %u2013 %u2013 %u2013 %u2013 %u2013 %u2013 %u2013Therapeutic, Diagnostic and other related Allied Health Professionals %u2013 %u2013 %u2013 %u2013 %u2013 %u2013 %u2013 %u2013 %u2013 %u2013 %u2013 %u2013 %u2013 %u2013 %u2013 %u2013 %u2013 %u2013 %u2013Educator s and r elated professionals %u2013 %u2013 %u2013 %u2013 %u2013 %u2013 %u2013 %u2013 %u2013 %u2013 %u2013 %u2013 %u2013 %u2013 %u2013 %u2013 %u2013 %u2013 %u2013Others such as interns, EPWP, learnerships, etc 210 8 022 212 9 211 138 9 453 140 70 210 9 171 140 9 584 140 9 910 140 10 356 -12.6% 4.1% 1.5%Total 1 112 524 855 1 098 543 451 1 018 591 242 1 051 72 1 123 604 848 1 449 655 698 1 449 674 322 1 449 704 664 8.9% 5.2% 100.0%1. Personnel numbers includes all filled posts together with those posts additional to the approved establishment Average annual growth over MTEF 2021/22 2022/23 2023/24 2024/25 2025/26 2026/27 2027/28 2024/25 - 2027/28Table 25 above shows the projected increase in compensation of employees as contributed by the adjustment in conditions of service of staff as anticipated by agreements in the Public Service Co-ordinating Bargaining Council (PSCBC). However, due to fiscal consolidation, very minimal growth will take place around expenditure on compensation of employees as this will only be for replacements in critical vacancies and for the employment of librarians in the newly constructed and existing libraries. The increase of posts is caused by new mandates such as the establishments of a new district i.e., Buffalo City Metropolitan, the separation of Corporate Service and Finance, based on Department of Public Service and Administration generic structures and National Treasury Generic Model (CFO Model), Language Act, Archives Act, the elevation of Communications, Risk and Security, ICT. Total restructuring of Museum structures, establishment of the Eastern Cape Provincial Geographical Names Committee (ECPGNC) and Eastern Cape Provincial Heritage Resources Agency (ECPHRA). 837
