
Page 862 - Demo
P. 862
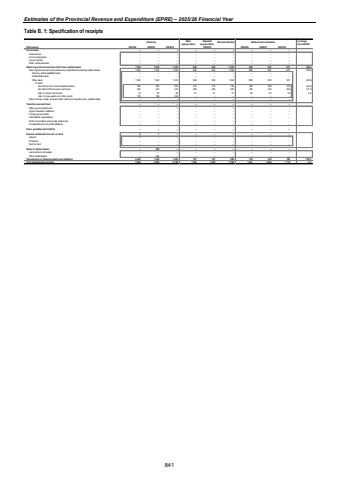
Estimates of the Provincial Revenue and Expenditure (EPRE) %u2013 2025/26 Financial YearTable B. 1: Specification of receipts Outcome Main appropriationAdjusted appropriation Revised estimate Medium-term estimates % change from 2024/25R thousand 2021/22 2022/23 2023/24 2025/26 2026/27 2027/28Tax receipts %u2013 %u2013 %u2013 %u2013 %u2013 %u2013 %u2013 %u2013 %u2013 Casino taxes %u2013 %u2013 %u2013 %u2013 %u2013 %u2013 %u2013 %u2013 %u2013 Horse racing taxes %u2013 %u2013 %u2013 %u2013 %u2013 %u2013 %u2013 %u2013 %u2013 Liquor licences %u2013 %u2013 %u2013 %u2013 %u2013 %u2013 %u2013 %u2013 %u2013 Motor vehicle licences %u2013 %u2013 %u2013 %u2013 %u2013 %u2013 %u2013 %u2013 %u2013 Sales of goods and services other than capital assets 1 004 1 043 1 323 849 849 1 262 889 930 972 (29.6)Sale of goods and services produced by department (excluding capital assets) 1 004 1 043 1 323 849 849 1 262 889 930 972 (29.6)Sales by market establishments %u2013 %u2013 %u2013 %u2013 %u2013 %u2013 %u2013 %u2013 %u2013 Administrative fees %u2013 %u2013 %u2013 %u2013 %u2013 %u2013 %u2013 %u2013 %u2013Other sales 1 004 1 043 1 323 849 849 1 262 889 930 972 (29.6)Of whichServ:Rend:Com Insurance&Garnishees 383 383 550 419 419 732 438 458 479 (40.2)Serv:Rend:Photocopiers and Faxes 465 474 419 409 409 509 429 449 469 (15.7)Sale of Tender documents 18 20 20 21 21 21 22 23 24 4.8Sale of scrap,wastre and other goods 138 166 334 %u2013 %u2013 %u2013 %u2013 %u2013 %u2013Sales of scrap, waste, arms and other used current goods (excl. capital assets) %u2013 %u2013 %u2013 %u2013 %u2013 %u2013 %u2013 %u2013 %u2013Transfers received from: %u2013 %u2013 %u2013 %u2013 %u2013 %u2013 %u2013 %u2013 %u2013Other governmental units %u2013 %u2013 %u2013 %u2013 %u2013 %u2013 %u2013 %u2013 %u2013Higher education institutions %u2013 %u2013 %u2013 %u2013 %u2013 %u2013 %u2013 %u2013 %u2013Foreign governments %u2013 %u2013 %u2013 %u2013 %u2013 %u2013 %u2013 %u2013 %u2013International organisations %u2013 %u2013 %u2013 %u2013 %u2013 %u2013 %u2013 %u2013 %u2013Public corporations and private enterprises %u2013 %u2013 %u2013 %u2013 %u2013 %u2013 %u2013 %u2013 %u2013Households and non-profit institutions %u2013 %u2013 %u2013 %u2013 %u2013 %u2013 %u2013 %u2013 %u2013Fines, penalties and forfeits %u2013 %u2013 %u2013 %u2013 %u2013 %u2013 %u2013 %u2013 %u2013Interest, dividends and rent on land 2 1 %u2013 %u2013 %u2013 %u2013 %u2013 %u2013 %u2013Interest 2 1 %u2013 %u2013 %u2013 %u2013 %u2013 %u2013 %u2013Dividends %u2013 %u2013 %u2013 %u2013 %u2013 %u2013 %u2013 %u2013 %u2013Rent on land %u2013 %u2013 %u2013 %u2013 %u2013 %u2013 %u2013 %u2013 %u2013Sales of capital assets %u2013 305 %u2013 %u2013 %u2013 %u2013 %u2013 %u2013 %u2013Land and sub-soil assets %u2013 %u2013 %u2013 %u2013 %u2013 %u2013 %u2013 %u2013 %u2013Other capital assets %u2013 305 %u2013 %u2013 %u2013 %u2013 %u2013 %u2013 %u2013Transactions in financial assets and liabilities 2 442 1 244 1 423 701 701 288 732 764 798 154.2Total departmental receipts 3 448 2 593 2 746 1 550 1 550 1 550 1 621 1 694 1 770 4.62024/25 841
