
Page 877 - Demo
P. 877
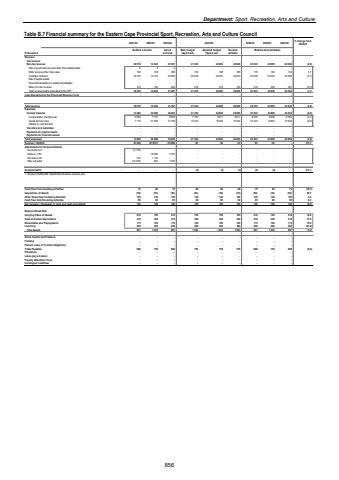
Department: Sport, Recreation, Arts and CultureTable B.7 Financial summary for the Eastern Cape Provincial Sport, Recreation, Arts and Culture Council 2021/22 2022/23 2023/24 2024/25 2025/26 2026/27 2027/28 % change from 2024/25R thousand Audited outcome Actual outcomeMain budget (Approved)Adjusted budget (Approved)Revised estimateRevenueTax revenue - - - - - - - - -Non-tax revenue 36 518 14 045 21 397 21 232 24 820 24 820 23 833 23 859 24 934 (4.0)Sale of goods and services other than capital assets 6 4 2 - - - - - -Entity revenue other than sales 180 729 466 168 168 168 176 184 192 4.7Transfers received 36 120 13 120 20 465 20 645 24 233 24 233 23 239 23 239 24 285 (4.1)Sale of capital assets - - - - - - - - -Financial transactions in assets and liabilities - - - - - - - - -Other non-tax revenue 212 192 464 419 419 419 418 436 457 (0.3)Total revenue before deposits into the PRF 36 518 14 045 21 397 21 232 24 820 24 820 23 833 23 859 24 934 (4.0)Less Deposits into the Provincial Revenue Fund - - - - - - - - -Total revenue 36 518 14 045 21 397 21 232 24 820 24 820 23 833 23 859 24 934 (4.0)ExpensesCurrent expense 13 482 35 096 30 403 21 232 24 820 24 820 23 833 23 859 24 934 (4.0)Compensation of employees 6 364 7 191 8 605 7 700 8 611 8 611 8 600 8 996 9 400 (0.1)Goods and services 7 118 27 905 21 798 13 532 16 209 16 209 15 233 14 863 15 534 (6.0)Interest on rent and land - - - - - - - - -Transfers and subsidies - - - - - - - - -Payments for capital assets - - - - - - - - -Payments for financial assets - - - - - - - - -Total expenses 13 482 35 096 30 403 21 232 24 820 24 820 23 833 23 859 24 934 (4.0)Surplus / (Deficit) 23 036 (21 051) (9 006) (0) (0) (0) (0) (0) - 265.9Adjustments for Surplus/(Deficit)Surrender to P (4 1 - - 76) - - - - - - - Rollover- Film - - 18 960 7 470 - - - - - - Services in-kin 379 - 1 139 - - - - - - - Other adjustme (19 - 952 239) 1 536 - - - - - - Surplus/(defici - - - - (0) (0) (0) (0) (0) - 265.91. Surplus/ (Deficit) after adjustments should be equal to zero.Cash flow from investing activities 75 90 75 90 90 90 75 90 75 (16.7)Acquisition of Assets (50) (30) (50) (30) (30) (30) (50) (30) (50) 66.7Other flows from Investing Activities 125 120 125 120 120 120 125 120 125 4.2Cash flow from financing activities 65 60 65 60 60 60 65 60 65 8.3Net increase / (decrease) in cash and cash equivalents 140 150 140 150 150 150 140 150 140 (6.7)Balance Sheet DataCarrying Value of Assets 216 195 216 195 195 195 216 195 216 10.8Cash and Cash Equivalents 410 349 410 349 349 349 410 349 410 17.5Receivables and Prepayments 115 100 115 100 100 100 115 100 115 15.0Inventory 250 380 250 380 380 380 250 380 250 (34.2)Total Assets 991 1 024 991 1 024 1 024 1 024 991 1 024 991 (3.2)Share Capital and Premium - - - - - - - - -Floating - - - - - - - - -Present value of Funded obligations - - - - - - - - -Trade Payables 698 750 698 750 750 750 698 750 698 (6.9)Provisions - - - - - - - - -Leave pay provision - - - - - - - - -Poverty Alleviation Fund - - - - - - - - -Contingent Liabilities - - - - - - - - -Medium-term estimates 856
