
Page 424 - Provincial Treasury Estimates.pdf
P. 424
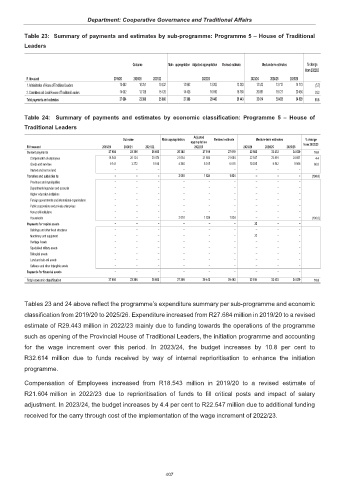
Department: Cooperative Governance and Traditional Affairs

           Table 23:  Summary of payments and estimates by sub-programme: Programme 5 – House of Traditional
           Leaders


                                                 Outcome      Main   appropriation Adjusted appropriation  Revised estimate  Medium-term estimates  % change
                                                                                                              from 2022/23
            R thousand                     2019/20  2020/21  2021/22      2022/23          2023/24  2024/25  2025/26
            1. Administration of House of Traditional Leaders                    13 682                   10 257                   10 532                           12 962                               13 283                               13 283                   12 523                   13 712                   14 173  (5.7)
            2. Committees and Local Houses of Traditional Leaders                    14 002                   13 139                   15 128                           14 436                               16 160                               16 160                   20 091                   19 721                   20 456  24.3
            Total payments and estimates                    27 684                   23 396                   25 660                           27 398                               29 443                               29 443                   32 614                   33 433                   34 629  10.8


           Table 24:  Summary of  payments  and estimates by economic classification: Programme  5 – House of
           Traditional Leaders

                                                                       Adjusted
                                              Outcome       Main appropriation  Revised estimate  Medium-term estimates  % change
                                                                      appropriation
            R thousand                 2019/20  2020/21  2021/22       2022/23          2023/24  2024/25  2025/26  from 2022/23
            Current payments                           27 684                   23 396                   25 660  25 380  27 619  27 619                   32 582                   33 433                   34 629  18.0
             Compensation of employees                     18 543                   20 124                   20 474  21 034  21 604  21 604                   22 547                   23 891                   24 661  4.4
             Goods and services                          9 141                     3 272                     5 186  4 346  6 015  6 015                   10 035                     9 542                     9 968  66.8
             Interest and rent on land     –       –      –        –        –        –       –      –       –
            Transfers and subsidies to:    –       –      –      2 018    1 824    1 824     –      –         –  (100.0)
             Provinces and municipalities   –      –      –        –        –        –       –      –         –
             Departmental agencies and accounts  –  –     –        –        –        –       –      –       –
             Higher education institutions  –      –      –        –        –        –       –      –       –
             Foreign governments and international organisations  –  –  –  –  –      –       –      –       –
             Public corporations and private enterprises  –  –  –  –        –        –       –      –       –
             Non-profit institutions       –       –      –        –        –        –       –      –       –
             Households                    –       –      –      2 018    1 824    1 824     –      –       –    (100.0)
            Payments for capital assets    –       –      –        –        –        –      32      –         –
             Buildings and other fixed structures  –  –   –        –        –        –       –      –       –
             Machinery and equipment       –       –      –        –        –        –      32      –       –
             Heritage Assets               –       –      –        –        –        –       –      –       –
             Specialised military assets   –       –      –        –        –        –       –      –       –
             Biological assets             –       –      –        –        –        –       –      –       –
             Land and sub-soil assets      –       –      –        –        –        –       –      –         –
             Software and other intangible assets  –  –   –        –        –        –       –      –         –
            Payments for financial assets  –       –      –        –        –        –       –      –       –
            Total economic classification                    27 684                   23 396                   25 660  27 398  29 443  29 443                   32 614                   33 433                   34 629  10.8


           Tables 23 and 24 above reflect the programme’s expenditure summary per sub-programme and economic
           classification from 2019/20 to 2025/26. Expenditure increased from R27.684 million in 2019/20 to a revised

           estimate of R29.443 million in 2022/23 mainly due to funding towards the operations of the programme
           such as opening of the Provincial House of Traditional Leaders, the initiation programme and accounting
           for  the wage increment over  this period.  In  2023/24, the budget increases by 10.8 per cent  to

           R32.614  million due to  funds received by way of internal  reprioritisation  to enhance  the initiation
           programme.

           Compensation of Employees increased from  R18.543 million in 2019/20  to a  revised estimate of

           R21.604 million in 2022/23 due to reprioritisation of funds to  fill critical posts and impact of salary
           adjustment. In 2023/24, the budget increases by 4.4 per cent to R22.547 million due to additional funding
           received for the carry through cost of the implementation of the wage increment of 2022/23.


                                                             407