
Page 135 - Demo
P. 135
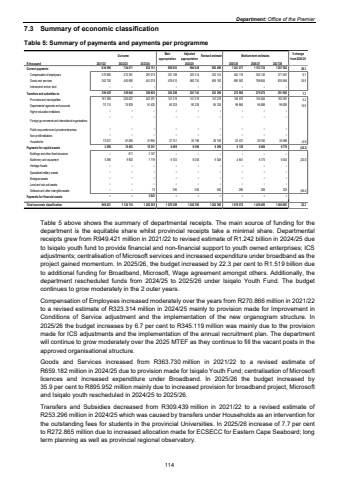
Department: Office of the Premier 7.3 Summary of economic classification Table 5: Summary of payments and payments per programme Outcome Main appropriationAdjusted appropriation Revised estimate Medium-term estimates % change from 2024/25R thousand 2021/22 2022/23 2023/24 2025/26 2026/27 2027/28Current payments 754 071 634 596 832 151 809 803 984 049 982 496 1 241 071 1 153 734 1 207 003 26.3Compensation of employees 270 866 270 381 291 075 331 188 323 314 323 314 345 119 355 130 371 057 6.7Goods and services 363 730 483 690 541 076 478 615 660 735 659 182 895 952 798 604 835 946 35.9Interest and rent on land %u2013 %u2013 %u2013 %u2013 %u2013 %u2013 %u2013 %u2013 %u2013Transfers and subsidies to: 309 439 359 640 356 805 254 288 251 743 253 296 272 865 279 275 291 902 7.7Provinces and municipalities 167 289 203 627 243 391 141 219 141 219 141 219 148 570 155 404 162 397 5.2Departmental agencies and accounts 70 113 74 928 81 420 85 328 85 328 85 328 98 864 94 688 99 009 15.9Higher education institutions %u2013 %u2013 %u2013 %u2013 %u2013 %u2013 %u2013 %u2013 %u2013Foreign governments and international organisations %u2013 %u2013 %u2013 %u2013 %u2013 %u2013 %u2013 %u2013 %u2013Public corporations and private enterprises %u2013 %u2013 %u2013 %u2013 %u2013 %u2013 %u2013 %u2013 %u2013Non-profit institutions %u2013 %u2013 %u2013 %u2013 %u2013 %u2013 %u2013 %u2013 %u2013Households 72 037 81 085 31 994 27 741 25 196 26 749 25 431 29 183 30 496 (4.9)Payments for capital assets 5 386 10 463 10 351 6 498 6 598 6 598 5 136 6 484 6 776 (22.2)Buildings and other fixed structures %u2013 611 3 157 %u2013 %u2013 %u2013 %u2013 %u2013 %u2013Machinery and equipment 5 386 9 852 7 119 6 103 6 048 6 048 4 841 6 175 6 453 (20.0)Heritage Assets %u2013 %u2013 %u2013 %u2013 %u2013 %u2013 %u2013 %u2013 %u2013Specialised military assets %u2013 %u2013 %u2013 %u2013 %u2013 %u2013 %u2013 %u2013 %u2013Biological assets %u2013 %u2013 %u2013 %u2013 %u2013 %u2013 %u2013 %u2013 %u2013Land and sub-soil assets %u2013 %u2013 %u2013 %u2013 %u2013 %u2013 %u2013 %u2013 %u2013Software and other intangible assets %u2013 %u2013 75 395 550 550 295 309 323 (46.4)Payments for financial assets %u2013 %u2013 3 943 %u2013 %u2013 %u2013 %u2013 %u2013 %u2013Total economic classification 949 421 1 124 174 1 203 250 1 070 589 1 242 390 1 242 390 1 519 072 1 439 493 1 505 681 22.32024/25 Table 5 above shows the summary of departmental receipts. The main source of funding for the department is the equitable share whilst provincial receipts take a minimal share. Departmental receipts grew from R949.421 million in 2021/22 to revised estimate of R1.242 billion in 2024/25 due to Isiqalo youth fund to provide financial and non-financial support to youth owned enterprises; ICS adjustments; centralisation of Microsoft services and increased expenditure under broadband as the project gained momentum. In 2025/26, the budget increased by 22.3 per cent to R1.519 billion due to additional funding for Broadband, Microsoft, Wage agreement amongst others. Additionally, the department rescheduled funds from 2024/25 to 2025/26 under Isiqalo Youth Fund. The budget continues to grow moderately in the 2 outer years. Compensation of Employees increased moderately over the years from R270.866 million in 2021/22 to a revised estimate of R323.314 million in 2024/25 mainly to provision made for Improvement in Conditions of Service adjustment and the implementation of the new organogram structure. In 2025/26 the budget increases by 6.7 per cent to R345.119 million was mainly due to the provision made for ICS adjustments and the implementation of the annual recruitment plan. The department will continue to grow moderately over the 2025 MTEF as they continue to fill the vacant posts in the approved organisational structure. Goods and Services increased from R363.730 million in 2021/22 to a revised estimate of R659.182 million in 2024/25 due to provision made for Isiqalo Youth Fund; centralisation of Microsoft licences and increased expenditure under Broadband. In 2025/26 the budget increased by 35.9 per cent to R895.952 million mainly due to increased provision for broadband project, Microsoft and Isiqalo youth rescheduled in 2024/25 to 2025/26. Transfers and Subsidies decreased from R309.439 million in 2021/22 to a revised estimate of R253.296 million in 2024/25 which was caused by transfers under Households as an intervention for the outstanding fees for students in the provincial Universities. In 2025/26 increase of 7.7 per cent to R272.865 million due to increased allocation made for ECSECC for Eastern Cape Seaboard; long term planning as well as provincial regional observatory. 114
