
Page 136 - Demo
P. 136
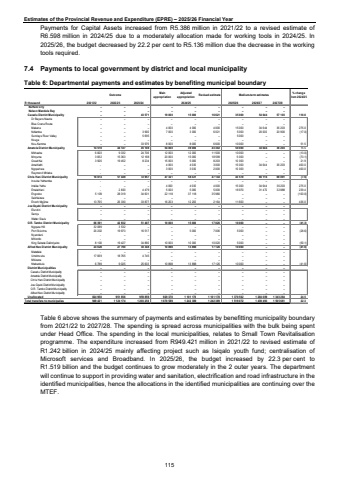
Estimates of the Provincial Revenue and Expenditure (EPRE) %u2013 2025/26 Financial Year Payments for Capital Assets increased from R5.386 million in 2021/22 to a revised estimate of R6.598 million in 2024/25 due to a moderately allocation made for working tools in 2024/25. In 2025/26, the budget decreased by 22.2 per cent to R5.136 million due the decrease in the working tools required. 7.4 Payments to local government by district and local municipality Table 6: Departmental payments and estimates by benefiting municipal boundary Outcome Main appropriationAdjusted appropriation Revised estimate Medium-term estimates % change from 2024/25R thousand 2021/22 2022/23 2023/24 2025/26 2026/27 2027/28 Buffalo City %u2013 %u2013 %u2013 %u2013 %u2013 %u2013 %u2013 %u2013 %u2013 Nelson Mandela Bay %u2013 %u2013 %u2013 %u2013 %u2013 %u2013 %u2013 %u2013 %u2013 Cacadu District Municipality %u2013 %u2013 43 571 19 000 15 000 16 621 35 000 54 644 57 103 110.6 Dr Beyers Naude %u2013 %u2013 %u2013 %u2013 %u2013 %u2013 %u2013 %u2013 %u2013 Blue Crane Route %u2013 %u2013 %u2013 %u2013 %u2013 %u2013 %u2013 %u2013 %u2013 Makana %u2013 %u2013 %u2013 4 000 4 000 4 000 15 000 34 644 36 203 275.0 Ndlambe %u2013 %u2013 3 900 7 000 3 000 6 021 5 000 20 000 20 900 (17.0) Sundays River Valley %u2013 %u2013 5 695 %u2013 %u2013 %u2013 5 000 %u2013 %u2013 Kouga %u2013 %u2013 %u2013 %u2013 %u2013 %u2013 %u2013 %u2013 %u2013 Kou-Kamma %u2013 %u2013 33 976 8 000 8 000 6 600 10 000 %u2013 %u2013 51.5Amatole District Municipality 14 578 44 147 45 108 54 000 39 000 43 302 50 000 34 644 36 203 15.5 Mbhashe 6 820 9 332 24 706 12 000 12 000 11 500 10 000 %u2013 (13.0) %u2013 Mnquma 3 832 15 363 12 168 20 000 15 000 18 599 5 000 %u2013 (73.1) %u2013 Great Kei 3 926 19 452 8 234 15 000 5 000 8 203 10 000 %u2013 %u2013 21.9 Amahlathi - %u2013 %u2013 4 000 4 000 3 000 15 000 34 644 36 203 400.0 Ngqushwa - %u2013 %u2013 3 000 3 000 2 000 10 000 %u2013 400.0 %u2013 Raymond Mhlaba - %u2013 %u2013 %u2013 %u2013 %u2013 %u2013 %u2013 %u2013 Chris Hani District Municipality 18 874 57 449 72 957 47 321 58 321 47 144 43 570 66 116 69 091 (7.6) Inxuba Yethemba - %u2013 %u2013 %u2013 %u2013 %u2013 %u2013 %u2013 %u2013 Intsika Yethu - %u2013 %u2013 4 000 4 000 4 000 15 000 34 644 36 203 275.0 Emalahleni - 2 800 4 479 5 000 5 000 5 000 16 970 31 472 32 888 239.4 Engcobo 5 109 28 319 34 601 22 118 37 118 35 980 %u2013 %u2013 %u2013 (100.0) Sakhisizwe %u2013 %u2013 %u2013 %u2013 %u2013 %u2013 %u2013 %u2013 %u2013 Enoch Mgijima 13 765 26 330 33 877 16 203 12 203 2 164 11 600 %u2013 436.0 %u2013Joe Gqabi District Municipality %u2013 %u2013 %u2013 %u2013 %u2013 %u2013 %u2013 %u2013 %u2013 Elundini %u2013 %u2013 %u2013 %u2013 %u2013 %u2013 %u2013 %u2013 %u2013 Senqu %u2013 %u2013 %u2013 %u2013 %u2013 %u2013 %u2013 %u2013 %u2013 Walter Sisulu %u2013 %u2013 %u2013 %u2013 %u2013 %u2013 %u2013 %u2013 %u2013 O.R. Tambo District Municipality 66 391 42 932 51 407 10 000 15 000 17 026 10 000 %u2013 (41.3) %u2013 Ngquza Hill 32 089 3 532 %u2013 %u2013 %u2013 %u2013 %u2013 %u2013 %u2013 Port St Johns 26 202 19 973 16 517 %u2013 5 000 7 006 5 000 %u2013 (28.6) %u2013 Nyandeni - %u2013 %u2013 %u2013 %u2013 %u2013 %u2013 %u2013 %u2013 Mhlontlo - %u2013 %u2013 %u2013 %u2013 %u2013 %u2013 %u2013 %u2013 King Sabata Dalindyebo 8 100 19 427 34 890 10 000 10 000 10 020 5 000 %u2013 (50.1) %u2013Alfred Nzo District Municipality 24 628 27 790 30 348 10 898 13 898 17 126 10 000 %u2013 (41.6) %u2013 Matatiele - %u2013 %u2013 %u2013 %u2013 %u2013 %u2013 %u2013 %u2013 Umzimvubu 17 839 18 765 4 745 %u2013 %u2013 %u2013 %u2013 %u2013 %u2013 Mbizana %u2013 %u2013 %u2013 %u2013 %u2013 %u2013 %u2013 %u2013 %u2013 Ntabankulu 6 789 9 025 25 603 10 898 13 898 17 126 10 000 %u2013 (41.6) %u2013District Municipalities %u2013 %u2013 %u2013 %u2013 %u2013 %u2013 %u2013 %u2013 %u2013 Cacadu District Municipality %u2013 %u2013 %u2013 %u2013 %u2013 %u2013 %u2013 %u2013 %u2013 Amatole District Municipality %u2013 %u2013 %u2013 %u2013 %u2013 %u2013 %u2013 %u2013 %u2013 Chris Hani District Municipality %u2013 %u2013 %u2013 %u2013 %u2013 %u2013 %u2013 %u2013 %u2013 Joe Gqabi District Municipality %u2013 %u2013 %u2013 %u2013 %u2013 %u2013 %u2013 %u2013 %u2013 O.R. Tambo District Municipality %u2013 %u2013 %u2013 %u2013 %u2013 %u2013 %u2013 %u2013 %u2013 Alfred Nzo District Municipality %u2013 %u2013 %u2013 %u2013 %u2013 %u2013 %u2013 %u2013 %u2013 Unallocated 824 950 951 856 959 859 929 370 1 101 170 1 101 170 1 370 502 1 284 089 1 343 284 24.5Total transfers to municipalies 949 421 1 124 174 1 203 250 1 070 589 1 242 389 1 242 389 1 519 072 1 439 493 1 505 681 22.32024/25 Table 6 above shows the summary of payments and estimates by benefitting municipality boundary from 2021/22 to 2027/28. The spending is spread across municipalities with the bulk being spent under Head Office. The spending in the local municipalities, relates to Small Town Revitalisation programme. The expenditure increased from R949.421 million in 2021/22 to revised estimate of R1.242 billion in 2024/25 mainly affecting project such as Isiqalo youth fund; centralisation of Microsoft services and Broadband. In 2025/26, the budget increased by 22.3 per cent to R1.519 billion and the budget continues to grow moderately in the 2 outer years. The department will continue to support in providing water and sanitation, electrification and road infrastructure in the identified municipalities, hence the allocations in the identified municipalities are continuing over the MTEF. 115
