
Page 139 - Demo
P. 139
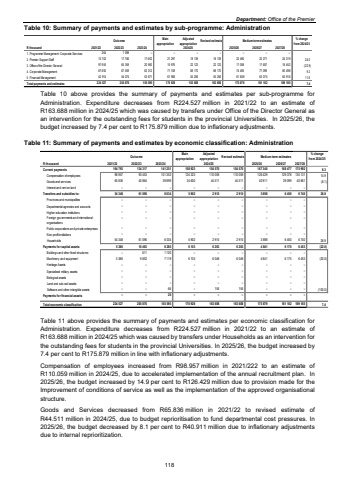
Department: Office of the Premier Table 10: Summary of payments and estimates by sub-programme: Administration Outcome Main appropriationAdjusted appropriation Revised estimate Medium-term estimates % change from 2024/25R thousand 2021/22 2022/23 2023/24 2025/26 2026/27 2027/281. Programme Management: Corporate Services 264 1 098 %u2013 %u2013 %u2013 %u2013 %u2013 %u2013 %u20132. Premier Support Staff 15 702 17 786 17 662 21 297 18 139 18 139 22 490 23 271 24 319 24.03. Office of the Director General 97 955 65 359 20 950 15 976 22 123 22 123 17 058 17 657 18 452 (22.9)4. Corporate Management 67 692 67 559 63 312 71 749 68 170 68 170 74 493 77 099 80 498 9.35. Financial Management 42 914 54 074 53 671 61 906 55 256 55 256 61 838 63 075 65 916 11.9Total payments and estimates 224 527 205 876 155 595 170 928 163 688 163 688 175 879 181 102 189 185 7.42024/25Table 10 above provides the summary of payments and estimates per sub-programme for Administration. Expenditure decreases from R224.527 million in 2021/22 to an estimate of R163.688 million in 2024/25 which was caused by transfers under Office of the Director General as an intervention for the outstanding fees for students in the provincial Universities. In 2025/26, the budget increased by 7.4 per cent to R175.879 million due to inflationary adjustments. Table 11: Summary of payments and estimates by economic classification: Administration Outcome Main appropriationAdjusted appropriation Revised estimate Medium-term estimates % change from 2024/25R thousand 2021/22 2022/23 2023/24 2025/26 2026/27 2027/28Current payments 134 317 164 793 141 251 158 923 154 570 154 570 167 340 168 477 175 992 8.3Compensation of employees 93 453 98 957 101 352 124 323 110 059 110 059 126 429 129 378 135 131 14.9Goods and services 40 864 65 836 39 899 34 600 44 511 44 511 40 911 39 099 40 861 (8.1)Interest and rent on land %u2013 %u2013 %u2013 %u2013 %u2013 %u2013 %u2013 %u2013 %u2013 Transfers and subsidies to: 61 096 54 348 6 034 5 902 2 915 2 915 3 698 6 450 6 740 26.9Provinces and municipalities %u2013 %u2013 %u2013 %u2013 %u2013 %u2013 %u2013 %u2013 %u2013 Departmental agencies and accounts %u2013 %u2013 %u2013 %u2013 %u2013 %u2013 %u2013 %u2013 %u2013 Higher education institutions %u2013 %u2013 %u2013 %u2013 %u2013 %u2013 %u2013 %u2013 %u2013Foreign governments and international organisations %u2013 %u2013 %u2013 %u2013 %u2013 %u2013 %u2013 %u2013 %u2013Public corporations and private enterprises %u2013 %u2013 %u2013 %u2013 %u2013 %u2013 %u2013 %u2013 %u2013Non-profit institutions %u2013 %u2013 %u2013 %u2013 %u2013 %u2013 %u2013 %u2013 %u2013Households 54 348 61 096 6 034 5 902 2 915 2 915 3 698 6 740 6 450 26.9Payments for capital assets 5 386 10 463 8 285 6 103 6 203 6 203 4 841 6 453 6 175 (22.0)Buildings and other fixed structures %u2013 611 1 100 %u2013 %u2013 %u2013 %u2013 %u2013 %u2013Machinery and equipment 5 386 9 852 7 119 6 103 6 048 6 048 4 841 6 453 6 175 (20.0)Heritage Assets %u2013 %u2013 %u2013 %u2013 %u2013 %u2013 %u2013 %u2013 %u2013Specialised military assets %u2013 %u2013 %u2013 %u2013 %u2013 %u2013 %u2013 %u2013 %u2013Biological assets %u2013 %u2013 %u2013 %u2013 %u2013 %u2013 %u2013 %u2013 %u2013Land and sub-soil assets %u2013 %u2013 %u2013 %u2013 %u2013 %u2013 %u2013 %u2013 %u2013Software and other intangible assets %u2013 %u2013 66 %u2013 155 155 %u2013 %u2013 %u2013 (100.0)Payments for financial assets %u2013 %u2013 25 %u2013 %u2013 %u2013 %u2013 %u2013 %u2013Total economic classification 224 527 205 876 155 595 170 928 163 688 163 688 175 879 189 185 181 102 7.42024/25Table 11 above provides the summary of payments and estimates per economic classification for Administration. Expenditure decreases from R224.527 million in 2021/22 to an estimate of R163.688 million in 2024/25 which was caused by transfers under Households as an intervention for the outstanding fees for students in the provincial Universities. In 2025/26, the budget increased by 7.4 per cent to R175.879 million in line with inflationary adjustments. Compensation of employees increased from R98.957 million in 2021/222 to an estimate of R110.059 million in 2024/25, due to accelerated implementation of the annual recruitment plan. In 2025/26, the budget increased by 14.9 per cent to R126.429 million due to provision made for the Improvement of conditions of service as well as the implementation of the approved organisational structure. Goods and Services decreased from R65.836 million in 2021/22 to revised estimate of R44.511 million in 2024/25, due to budget reprioritisation to fund departmental cost pressures. In 2025/26, the budget decreased by 8.1 per cent to R40.911 million due to inflationary adjustments due to internal reprioritization. 118
