
Page 147 - Demo
P. 147
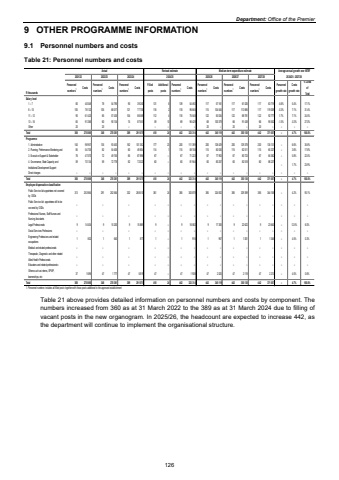
Department: Office of the Premier 9 OTHER PROGRAMME INFORMATION 9.1 Personnel numbers and costs Table 21: Personnel numbers and costs Actual Revised estimate Medium-term expenditure estimateR thousandsPersonnel numbers1 Costs Personnel numbers1 Costs Personnel numbers1 Costs Filled postsAdditional postsPersonnel numbers1 Costs Personnel numbers1 Costs Personnel numbers1 Costs Personnel numbers1 Costs Personnel growth rate Costs growth rate % Costs of Total Salary level1 %u2013 7 80 40 048 78 54 795 90 39 250 131 8 139 54 492 117 57 161 117 61 026 117 63 719 -5.6% 5.4% 17.1%8 %u2013 10 105 78 132 105 68 017 121 77 705 116 2 118 96 845 115 104 545 117 113 885 117 119 009 -0.3% 7.1% 31.4%11 %u2013 12 90 61 420 85 57 435 104 86 569 112 4 116 75 548 122 83 034 122 88 781 122 92 777 1.7% 7.1% 24.5%13 %u2013 16 65 91 266 60 90 134 74 87 551 59 10 69 96 429 68 100 379 66 91 438 66 95 552 -1.5% -0.3% 27.0%Other 20 20 %u2013 %u2013 %u2013 %u2013 %u2013 20 %u2013 20 %u2013 20 %u2013 %u2013 %u2013 %u2013Total 360 270 866 348 270 381 389 291 075 418 24 442 323 314 442 345 119 442 355 130 442 371 057 %u2013 4.7% 100.0%Programme1. Administration 140 98 957 135 93 453 162 101 352 177 23 200 111 399 200 126 429 200 129 378 200 135 131 %u2013 6.6% 35.8%2. Planning, Performance Monitoring and 85 54 705 82 54 405 60 49 804 114 1 115 58 748 115 60 530 115 62 511 115 65 327 %u2013 3.6% 17.8%3. Ex ecutiv e Support & Stakeholder 76 47 070 72 49 745 85 67 896 67 %u2013 67 71 223 67 77 903 67 80 723 67 84 362 %u2013 5.8% 22.5%4. Gov ernance, State Capacity and Institutional Dev elopment Support59 70 134 59 72 778 82 72 023 60 %u2013 60 81 944 60 80 257 60 82 518 60 86 237 %u2013 1.7% 23.9%Direct charges %u2013 %u2013 %u2013 %u2013 %u2013 %u2013 %u2013 %u2013 %u2013 %u2013 %u2013 %u2013 %u2013 %u2013 %u2013 %u2013 %u2013 %u2013 %u2013Total 360 270 866 348 270 381 389 291 075 418 24 442 323 314 442 345 119 442 355 130 442 371 057 %u2013 4.7% 100.0%Employee dispensation classificationPublic Serv ice Act appointees not cov ered by OSDs313 253 864 291 252 564 332 268 510 361 24 385 303 878 385 324 832 385 329 389 385 344 158 %u2013 4.2% 93.1%Public Serv ice Act appointees still to be cov ered by OSDs %u2013 %u2013 %u2013 %u2013 %u2013 %u2013 %u2013 %u2013 %u2013 %u2013 %u2013 %u2013 %u2013 %u2013 %u2013 %u2013Professional Nurses, Staff Nurses and Nursing Assistants %u2013 %u2013 %u2013 %u2013 %u2013 %u2013 %u2013 %u2013 %u2013 %u2013 %u2013 %u2013 %u2013 %u2013 %u2013 %u2013Legal Professionals 9 14 504 9 15 200 9 15 869 9 %u2013 9 16 582 9 17 305 9 22 622 9 23 640 %u2013 12.5% 6.0%Social Serv ices Professions %u2013 %u2013 %u2013 %u2013 %u2013 %u2013 %u2013 %u2013 %u2013 %u2013 %u2013 %u2013 %u2013 %u2013 %u2013 %u2013Engineering Professions and related occupations 1 802 1 840 1 877 1 %u2013 1 916 1 957 1 1 001 1 1 046 %u2013 4.5% 0.3%Medical and related professionals %u2013 %u2013 %u2013 %u2013 %u2013 %u2013 %u2013 %u2013 %u2013 %u2013 %u2013 %u2013 %u2013 %u2013 %u2013 %u2013Therapeutic, Diagnostic and other related Allied Health Professionals %u2013 %u2013 %u2013 %u2013 %u2013 %u2013 %u2013 %u2013 %u2013 %u2013 %u2013 %u2013 %u2013 %u2013 %u2013 %u2013Educators and related professionals %u2013 %u2013 %u2013 %u2013 %u2013 %u2013 %u2013 %u2013 %u2013 %u2013 %u2013 %u2013 %u2013 %u2013 %u2013 %u2013Others such as interns, EPWP, learnerships, etc37 1 696 47 1 777 47 5 819 47 %u2013 47 1 938 47 2 025 47 2 118 47 2 213 %u2013 4.5% 0.6%Total 360 270 866 348 270 381 389 291 075 418 24 442 323 314 442 345 119 442 355 130 442 371 057 %u2013 4.7% 100.0%1. Personnel numbers includes all filled posts together with those posts additional to the approved establishment Average annual growth over MTEF 2021/22 2022/23 2023/24 2024/25 2025/26 2026/27 2027/28 2024/25 - 2027/28Table 21 above provides detailed information on personnel numbers and costs by component. The numbers increased from 360 as at 31 March 2022 to the 389 as at 31 March 2024 due to filling of vacant posts in the new organogram. In 2025/26, the headcount are expected to increase 442, as the department will continue to implement the organisational structure. 126
