
Page 151 - Demo
P. 151
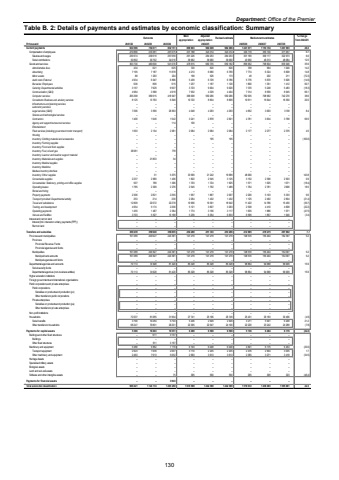
Department: Office of the Premier Table B. 2: Details of payments and estimates by economic classification: Summary Outcome Main appropriationAdjusted appropriation Revised estimate Medium-term estimates % change from 2024/25R thousand 2021/22 2022/23 2023/24 2025/26 2026/27 2027/28Current payments 754 071 634 596 832 151 809 803 984 049 982 496 1 241 071 1 153 734 1 207 003 26.3Compensation of employees 270 866 270 381 291 075 331 188 323 314 323 314 345 119 355 130 371 057 6.7Salaries and wages 239 974 239 619 257 059 291 226 284 253 284 253 301 169 309 117 322 973 6.0Social contributions 30 892 30 762 34 016 39 962 39 060 39 060 43 950 46 013 48 084 12.5Goods and services 363 730 483 690 541 076 478 615 660 735 659 182 895 952 798 604 835 946 35.9Administrative fees 621 434 625 720 620 620 708 994 1 040 14.2Advertising 7 187 7 195 11 878 4 213 6 680 6 769 7 774 6 324 6 608 14.8Minor assets 1 203 88 224 198 526 173 48 202 211 (72.3)Audit costs: External 6 047 4 934 6 896 5 439 6 729 6 786 5 776 5 670 5 926 (14.9)Bursaries: Employees 636 899 615 1 237 1 187 1 120 1 800 1 351 1 412 60.7Catering: Departmental activities 3 157 7 929 9 507 3 723 9 004 9 020 7 370 5 248 5 483 (18.3)Communication (G&S) 4 984 3 568 4 919 7 932 4 329 4 404 7 314 8 559 8 945 66.1Computer services 265 298 369 915 418 947 368 008 550 266 550 266 762 935 708 962 742 270 38.6Consultants: Business and advisory services 8 125 13 793 6 649 10 722 8 834 8 809 10 611 15 644 16 350 20.5Infrastructure and planning services %u2013 %u2013 %u2013 %u2013 %u2013 %u2013 %u2013 %u2013 %u2013Laboratory services %u2013 %u2013 %u2013 %u2013 %u2013 %u2013 %u2013 %u2013 %u2013Legal services (G&S) 7 296 3 559 26 653 4 048 4 293 4 293 4 652 3 003 3 138 8.4Science and technological services %u2013 %u2013 %u2013 %u2013 %u2013 %u2013 %u2013 %u2013 %u2013Contractors 1 400 1 949 1 542 3 241 2 878 2 821 4 781 3 634 3 798 69.5Agency and support/outsourced services %u2013 %u2013 114 100 %u2013 %u2013 %u2013 %u2013 %u2013Entertainment %u2013 %u2013 %u2013 %u2013 %u2013 %u2013 %u2013 %u2013 %u2013Fleet services (including government motor transport) 1 093 2 134 2 061 2 084 2 084 2 084 2 177 2 277 2 379 4.5Housing %u2013 %u2013 %u2013 %u2013 %u2013 %u2013 %u2013 %u2013 %u2013Inventory: Clothing material and accessories %u2013 %u2013 %u2013 %u2013 195 195 %u2013 %u2013 %u2013 (100.0)Inventory: Farming supplies %u2013 %u2013 %u2013 %u2013 %u2013 %u2013 %u2013 %u2013 %u2013Inventory: Food and food supplies %u2013 %u2013 %u2013 %u2013 %u2013 %u2013 %u2013 %u2013 %u2013Inventory: Fuel, oil and gas 29 081 %u2013 778 %u2013 %u2013 %u2013 %u2013 %u2013 %u2013Inventory: Learner and teacher support material %u2013 %u2013 %u2013 %u2013 %u2013 %u2013 %u2013 %u2013 %u2013Inventory: Materials and supplies %u2013 21 803 34 %u2013 %u2013 %u2013 %u2013 %u2013 %u2013Inventory: Medical supplies %u2013 %u2013 %u2013 %u2013 %u2013 %u2013 %u2013 %u2013 %u2013Inventory: Medicine %u2013 %u2013 %u2013 %u2013 %u2013 %u2013 %u2013 %u2013 %u2013Medsas inventory interface %u2013 %u2013 %u2013 %u2013 %u2013 %u2013 %u2013 %u2013 %u2013Inventory: Other supplies %u2013 31 5 075 33 569 21 242 19 689 48 000 %u2013 %u2013 143.8Consumable supplies 2 237 2 669 1 436 1 822 2 545 3 125 3 152 2 396 2 503 0.9Consumables: Stationery, printing and office supplies 507 799 1 306 1 703 1 724 1 925 1 571 1 025 1 071 (18.4)Operating leases 1 785 2 309 2 276 2 545 1 792 1 489 1 764 2 781 2 906 18.5Rental and hiring %u2013 %u2013 %u2013 %u2013 %u2013 %u2013 %u2013 %u2013 %u2013Property payments 2 306 2 821 2 295 1 957 1 867 2 007 2 200 5 103 5 333 9.6Transport provided: Departmental activity 253 214 230 2 264 1 432 1 432 1 125 2 492 2 604 (21.4)Travel and subsistence 12 809 22 072 22 278 10 956 19 391 18 942 11 422 14 786 15 450 (39.7)Training and development 4 954 5 174 2 206 5 121 3 607 3 263 2 538 4 410 4 608 (22.2)Operating payments 1 455 1 467 2 364 1 774 3 156 3 117 1 635 1 886 1 971 (47.5)Venues and facilities 3 703 5 527 10 168 5 239 6 354 6 833 6 599 1 857 1 940 (3.4)Interest and rent on land %u2013 %u2013 %u2013 %u2013 %u2013 %u2013 %u2013 %u2013 %u2013Interest (Incl. interest on unitary payments (PPP)) %u2013 %u2013 %u2013 %u2013 %u2013 %u2013 %u2013 %u2013 %u2013Rent on land %u2013 %u2013 %u2013 %u2013 %u2013 %u2013 %u2013 %u2013 %u2013Transfers and subsidies 309 439 359 640 356 805 254 288 251 743 253 296 272 865 279 275 291 902 7.7 Provinces and municipalities 167 289 203 627 243 391 141 219 141 219 141 219 148 570 155 404 162 397 5.2Provinces %u2013 %u2013 %u2013 %u2013 %u2013 %u2013 %u2013 %u2013 %u2013Provincial Revenue Funds %u2013 %u2013 %u2013 %u2013 %u2013 %u2013 %u2013 %u2013 %u2013Provincial agencies and funds %u2013 %u2013 %u2013 %u2013 %u2013 %u2013 %u2013 %u2013 %u2013Municipalities 167 289 203 627 243 391 141 219 141 219 141 219 148 570 155 404 162 397 5.2Municipal bank accounts 167 289 203 627 243 391 141 219 141 219 141 219 148 570 155 404 162 397 5.2Municipal agencies and funds %u2013 %u2013 %u2013 %u2013 %u2013 %u2013 %u2013 %u2013 %u2013Departmental agencies and accounts 70 113 74 928 81 420 85 328 85 328 85 328 98 864 94 688 99 009 15.9Social security funds %u2013 %u2013 %u2013 %u2013 %u2013 %u2013 %u2013 %u2013 %u2013Departmental agencies (non-business entities) 70 113 74 928 81 420 85 328 85 328 85 328 98 864 94 688 99 009 15.9Higher education institutions %u2013 %u2013 %u2013 %u2013 %u2013 %u2013 %u2013 %u2013 %u2013Foreign governments and international organisations %u2013 %u2013 %u2013 %u2013 %u2013 %u2013 %u2013 %u2013 %u2013Public corporations and private enterprises %u2013 %u2013 %u2013 %u2013 %u2013 %u2013 %u2013 %u2013 %u2013Public corporations %u2013 %u2013 %u2013 %u2013 %u2013 %u2013 %u2013 %u2013 %u2013Subsidies on products and production (pc) %u2013 %u2013 %u2013 %u2013 %u2013 %u2013 %u2013 %u2013 %u2013Other transfers to public corporations %u2013 %u2013 %u2013 %u2013 %u2013 %u2013 %u2013 %u2013 %u2013Private enterprises %u2013 %u2013 %u2013 %u2013 %u2013 %u2013 %u2013 %u2013 %u2013Subsidies on products and production (pe) %u2013 %u2013 %u2013 %u2013 %u2013 %u2013 %u2013 %u2013 %u2013Other transfers to private enterprises %u2013 %u2013 %u2013 %u2013 %u2013 %u2013 %u2013 %u2013 %u2013Non-profit institutions %u2013 %u2013 %u2013 %u2013 %u2013 %u2013 %u2013 %u2013 %u2013Households 72 037 81 085 31 994 27 741 25 196 26 749 25 431 29 183 30 496 (4.9)Social benefits 3 790 10 284 5 793 5 436 2 649 2 649 3 211 5 941 6 208 21.2Other transfers to households 68 247 70 801 26 201 22 305 22 547 24 100 22 220 23 242 24 288 (7.8)Payments for capital assets 5 386 10 463 10 351 6 498 6 598 6 598 5 136 6 484 6 776 (22.2)Buildings and other fixed structures %u2013 611 3 157 %u2013 %u2013 %u2013 %u2013 %u2013 %u2013Buildings %u2013 %u2013 %u2013 %u2013 %u2013 %u2013 %u2013 %u2013 %u2013Other fixed structures %u2013 611 3 157 %u2013 %u2013 %u2013 %u2013 %u2013 %u2013Machinery and equipment 5 386 9 852 7 119 6 103 6 048 6 048 4 841 6 175 6 453 (20.0)Transport equipment 2 923 1 939 2 067 3 110 2 435 2 435 2 476 2 904 3 035 1.7Other machinery and equipment 2 463 7 913 5 052 2 993 3 613 3 613 2 365 3 271 3 418 (34.5)Heritage Assets %u2013 %u2013 %u2013 %u2013 %u2013 %u2013 %u2013 %u2013 %u2013Specialised military assets %u2013 %u2013 %u2013 %u2013 %u2013 %u2013 %u2013 %u2013 %u2013Biological assets %u2013 %u2013 %u2013 %u2013 %u2013 %u2013 %u2013 %u2013 %u2013Land and sub-soil assets %u2013 %u2013 %u2013 %u2013 %u2013 %u2013 %u2013 %u2013 %u2013Software and other intangible assets %u2013 %u2013 75 395 550 550 295 309 323 (46.4)Payments for financial assets %u2013 %u2013 3 943 %u2013 %u2013 %u2013 %u2013 %u2013 %u2013Total economic classification 949 421 1 124 174 1 203 250 1 070 589 1 242 390 1 242 390 1 519 072 1 439 493 1 505 681 22.32024/25130
