
Page 198 - Demo
P. 198
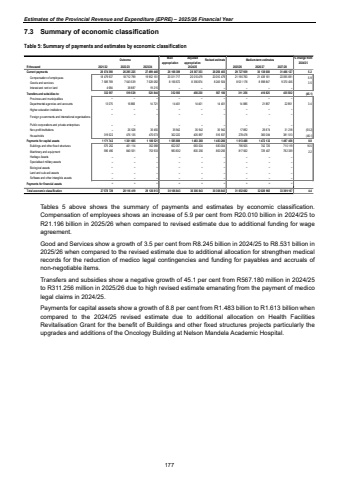
Estimates of the Provincial Revenue and Expenditure (EPRE) %u2013 2025/26 Financial Year7.3 Summary of economic classification Table 5: Summary of payments and estimates by economic classification Outcome Main appropriationAdjusted appropriation Revised estimate Medium-term estimates % change from 2024/25R thousand 2021/22 2022/23 2023/24 2025/26 2026/27 2027/28Current payments 26 295 225 26 074 390 27 499 448 28 168 389 28 367 353 28 256 403 29 727 939 30 138 008 31 466 127 5.2Compensation of employees 18 712 799 18 479 937 19 952 151 20 011 717 20 010 479 20 010 479 21 196 760 21 439 161 22 095 691 5.9Goods and services 7 543 539 7 589 769 7 528 082 8 156 672 8 356 874 8 245 924 8 531 178 8 698 847 9 370 436 3.5Interest and rent on land 38 887 4 684 19 215 %u2013 %u2013 %u2013 %u2013 %u2013 %u2013 Transfers and subsidies to: 519 529 332 597 520 844 352 565 456 230 567 180 311 256 416 825 435 582 (45.1)Provinces and municipalities %u2013 %u2013 %u2013 %u2013 %u2013 %u2013 %u2013 %u2013 %u2013 Departmental agencies and accounts 16 866 13 075 14 721 14 401 14 401 14 401 14 886 21 867 22 851 3.4Higher education institutions %u2013 %u2013 %u2013 %u2013 %u2013 %u2013 %u2013 %u2013 %u2013Foreign governments and international organisations %u2013 %u2013 %u2013 %u2013 %u2013 %u2013 %u2013 %u2013 %u2013Public corporations and private enterprises %u2013 %u2013 %u2013 %u2013 %u2013 %u2013 %u2013 %u2013 %u2013Non-profit institutions 26 528 %u2013 35 450 35 942 35 942 35 942 17 892 29 874 31 218 (50.2)Households 319 522 476 135 470 673 302 222 405 887 516 837 278 478 365 084 381 513 (46.1)Payments for capital assets 1 171 742 1 301 665 1 106 521 1 585 889 1 483 260 1 483 260 1 613 488 1 472 132 1 497 458 8.8Buildings and other fixed structures 575 252 461 114 352 588 602 057 683 004 683 004 795 925 742 725 715 119 16.5Machinery and equipment 596 490 840 551 753 933 983 832 800 256 800 256 817 562 729 407 782 339 2.2Heritage Assets %u2013 %u2013 %u2013 %u2013 %u2013 %u2013 %u2013 %u2013 %u2013Specialised military assets %u2013 %u2013 %u2013 %u2013 %u2013 %u2013 %u2013 %u2013 %u2013Biological assets %u2013 %u2013 %u2013 %u2013 %u2013 %u2013 %u2013 %u2013 %u2013Land and sub-soil assets %u2013 %u2013 %u2013 %u2013 %u2013 %u2013 %u2013 %u2013 %u2013Software and other intangible assets %u2013 %u2013 %u2013 %u2013 %u2013 %u2013 %u2013 %u2013 %u2013Payments for financial assets %u2013 %u2013 %u2013 %u2013 %u2013 %u2013 %u2013 %u2013 %u2013Total economic classification 27 578 729 28 116 419 29 126 813 30 106 843 30 306 843 30 306 843 31 652 682 32 026 965 33 399 167 4.42024/25 Tables 5 above shows the summary of payments and estimates by economic classification. Compensation of employees shows an increase of 5.9 per cent from R20.010 billion in 2024/25 to R21.196 billion in 2025/26 when compared to revised estimate due to additional funding for wage agreement. Good and Services show a growth of 3.5 per cent from R8.245 billion in 2024/25 to R8.531 billion in 2025/26 when compared to the revised estimate due to additional allocation for strengthen medical records for the reduction of medico legal contingencies and funding for payables and accruals of non-negotiable items. Transfers and subsidies show a negative growth of 45.1 per cent from R567.180 million in 2024/25 to R311.256 million in 2025/26 due to high revised estimate emanating from the payment of medico legal claims in 2024/25. Payments for capital assets show a growth of 8.8 per cent from R1.483 billion to R1.613 billion when compared to the 2024/25 revised estimate due to additional allocation on Health Facilities Revitalisation Grant for the benefit of Buildings and other fixed structures projects particularly the upgrades and additions of the Oncology Building at Nelson Mandela Academic Hospital. 177
