
Page 202 - Demo
P. 202
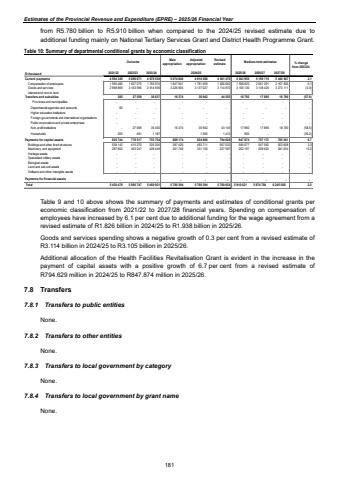
Estimates of the Provincial Revenue and Expenditure (EPRE) %u2013 2025/26 Financial Yearfrom R5.780 billion to R5.910 billion when compared to the 2024/25 revised estimate due to additional funding mainly on National Tertiary Services Grant and District Health Programme Grant. Table 10: Summary of departmental conditional grants by economic classification Outcome Mainappropriation Adjusted appropriation Revised estimate Medium-term estimates2021/22 2022/23 2023/24 2024/25 2025/26 2026/27 2027/284 594 349 5 090 671 4 670 530 5 074 846 4 918 586 4 941 470 5 043 955 5 199 716 5 440 947 2.1 1 595 480 1 927 075 1 755 974 1 847 941 1 781 559 1 826 600 1 938 825 2 061 291 2 167 836 6.1 2 998 869 3 163 596 2 914 556 3 226 905 3 137 027 3 114 870 3 105 130 3 138 425 3 273 111 (0.3)Transfers and subsidies 385 27 559 36 637 16 374 36 942 44 555 18 792 17 895 18 700 (57.8)Provinces and municipalities - - - - - - - - - - Departmental agencies and accounts 80 - - - - - - - - - Higher education institutions - - - - - - - - - - Foreign governments and international organisations - - - - - - - - - - Public corporations and private enterprises - - - - - - - - - - Non-profit institutions - 27 068 35 450 16 374 35 942 43 145 17 892 17 895 18 700 (58.5) Households 305 491 1 187 - 1 000 1 410 900 - (36.2) 825 744 778 517 753 754 689 174 824 866 794 629 847 874 757 173 785 361 6.7 538 142 415 270 325 305 387 426 493 711 567 032 585 677 547 550 503 908 3.3 287 602 363 247 428 449 301 748 331 155 227 597 262 197 209 623 281 454 15.2 - - - - - - - - - - - - - - - - - - - - - - - - - - - - - - - - - - - - - - - - - - - - - - - - - - - - - - - - - - - - 5 420 478 5 896 747 5 460 921 5 780 394 5 780 394 5 780 654 5 910 621 5 974 784 6 245 008 2.2 % change from 2023/24 R thousandBiological assetsLand and sub-soil assetsSoftware and other intangible assetsPayments for financial assets TotalPayments for capital assetsBuildings and other fixed structuresMachinery and equipmentHeritage assetsSpecialised military assetsCurrent paymentsCompensation of employeesGoods and servicesInterest and rent on land Table 9 and 10 above shows the summary of payments and estimates of conditional grants per economic classification from 2021/22 to 2027/28 financial years. Spending on compensation of employees have increased by 6.1 per cent due to additional funding for the wage agreement from a revised estimate of R1.826 billion in 2024/25 to R1.938 billion in 2025/26. Goods and services spending shows a negative growth of 0.3 per cent from a revised estimate of R3.114 billion in 2024/25 to R3.105 billion in 2025/26. Additional allocation of the Health Facilities Revitalisation Grant is evident in the increase in the payment of capital assets with a positive growth of 6.7 per cent from a revised estimate of R794.629 million in 2024/25 to R847.874 million in 2025/26. 7.8 Transfers 7.8.1 Transfers to public entities None. 7.8.2 Transfers to other entities None. 7.8.3 Transfers to local government by category None. 7.8.4 Transfers to local government by grant name None. 181
