
Page 199 - Demo
P. 199
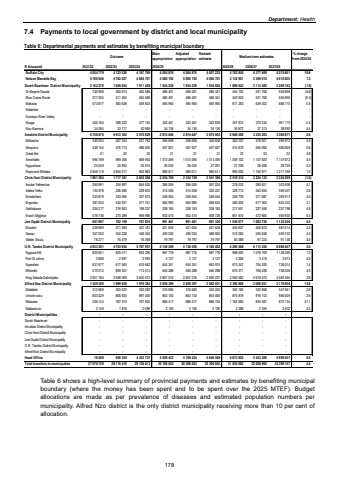
Department: Health7.4 Payments to local government by district and local municipality Table 6: Departmental payments and estimates by benefiting municipal boundary Main appropriationAdjusted appropriationRevised estimate % change from 2024/25 R thousand 2021/22 2022/23 2023/24 2024/25 2025/26 2026/27 2027/28 Buffalo City 4 054 779 4 123 038 4 167 769 4 004 876 4 004 876 4 007 232 4 762 845 4 377 609 4 574 601 18.9 Nelson Mandela Bay 5 780 946 5 792 027 4 884 767 5 060 192 5 060 192 5 066 781 5 132 901 5 369 014 5 610 620 1.3 Sarah Baartman District Municipality 2 162 276 1 859 654 1 911 409 1 934 538 1 934 539 1 934 604 1 899 943 2 114 585 2 209 742 (1.8) Dr Beyers Naude 740 908 465 813 465 586 486 491 486 491 486 341 454 192 531 768 555 698 (6.6) Blue Crane Route 477 304 411 264 465 586 486 491 486 491 486 341 440 924 531 768 555 698 (9.3) Makana 573 817 560 638 559 823 584 960 584 960 584 960 611 283 639 402 668 175 4.5 Ndlambe - - - - - - - - - - Sundays River Valley - - - - - - - - - - Kouga 336 164 388 222 377 745 342 461 342 461 342 826 357 872 374 334 391 179 4.4 Kou-Kamma 34 084 33 717 42 669 34 136 34 136 34 136 35 672 37 313 38 992 4.5 Amatole District Municipality 6 756 076 6 612 302 2 575 629 2 874 646 2 874 647 2 875 903 2 949 266 3 235 283 3 380 871 2.6 Mbhashe 340 054 287 244 531 762 346 658 346 658 346 658 362 257 378 921 395 972 4.5 Mnquma 448 154 476 713 486 005 507 827 507 827 507 827 510 679 555 090 580 069 0.6 Great Kei 21 20 20 21 21 21 22 23 24 4.8 Amahlathi 994 189 969 356 569 944 1 013 495 1 013 495 1 013 495 1 059 102 1 107 820 1 157 672 4.5 Ngqushwa 25 539 24 952 24 916 26 035 26 035 27 291 27 206 28 458 29 739 0.3- Raymond Mhlaba 4 948 119 4 854 017 962 982 980 611 980 611 980 611 990 000 1 164 971 1 217 395 1.0 Chris Hani District Municipality 1 861 384 1 717 301 2 653 306 2 534 750 2 534 749 2 541 366 2 516 314 2 224 123 2 324 209 (1.0) Inxuba Yethemba 260 991 254 997 664 626 266 059 266 059 267 024 278 032 290 821 303 908 4.1 Intsika Yethu 194 578 206 485 209 833 314 558 314 558 320 247 328 713 343 834 359 307 2.6 Emalahleni 243 819 233 595 237 873 248 554 248 554 248 554 259 739 271 687 283 913 4.5 Engcobo 381 033 534 931 371 741 564 980 564 980 568 632 580 405 617 563 645 353 2.1 Sakhisizwe 204 217 216 903 199 237 208 183 208 183 208 183 217 551 227 558 237 798 4.5 Enoch Mgijima 576 745 270 389 969 996 932 415 932 415 928 726 851 874 472 660 493 930 8.3- Joe Gqabi District Municipality 661 997 702 169 761 874 991 461 991 461 991 336 1 036 077 1 083 736 1 132 504 4.5 Elundini 226 669 271 463 337 161 421 634 421 634 421 634 440 607 460 875 481 614 4.5 Senqu 357 052 354 228 348 345 490 030 490 030 489 905 512 082 535 638 559 742 4.5 Walter Sisulu 78 277 76 479 76 368 79 797 79 797 79 797 83 388 87 223 91 148 4.5 O.R. Tambo District Municipality 4 933 391 4 753 934 5 767 937 5 138 559 5 138 558 5 160 402 5 290 568 6 113 356 6 088 457 2.5 Ngquza Hill 852 651 835 511 834 296 987 776 987 776 987 776 998 000 1 079 709 1 128 296 1.0 Port St Johns 2 668 2 997 2 993 3 127 3 127 3 127 3 268 3 419 3 573 4.5 Nyandeni 631 677 617 560 616 662 644 351 644 351 663 974 673 347 704 320 736 014 1.4 Mhlontlo 519 212 699 357 713 513 646 288 646 288 646 288 675 371 706 438 738 228 4.5 King Sabata Dalindyebo 2 927 184 2 598 509 3 600 473 2 857 016 2 857 016 2 859 237 2 940 582 3 619 470 3 482 346 2.8 Alfred Nzo District Municipality 1 349 309 1 899 638 1 970 385 2 058 398 2 058 397 2 082 651 2 390 866 2 086 051 2 178 606 14.8 Matatiele 310 589 303 523 303 082 316 690 316 690 340 252 350 180 332 958 347 941 2.9 Umzimvubu 830 429 806 924 897 405 853 100 853 100 853 465 875 818 916 102 956 009 2.6 Mbizana 206 143 787 374 767 802 886 417 886 417 886 744 1 162 580 834 597 872 154 31.1 Ntabankulu 2 149 1 818 2 096 2 190 2 190 2 190 2 288 2 394 2 502 4.5 District Municipalities - - - - - - - - - Sarah Baartman - - - - - - - - - Amatole District Municipality - - - - - - - - - Chris Hani District Municipality - - - - - - - - - Joe Gqabi District Municipality - - - - - - - - - O.R. Tambo District Municipality - - - - - - - - - Alfred Nzo District Municipality - - - - - - - - - Head Office 18 569 656 355 4 433 737 5 509 423 5 709 424 5 646 568 5 673 902 5 423 208 5 899 557 0.5 Total transfers to municipalies 27 578 729 28 116 419 29 126 813 30 106 843 30 306 843 30 306 843 31 652 682 32 026 965 33 399 167 4.4 Outcome Medium-term estimates Table 6 shows a high-level summary of provincial payments and estimates by benefiting municipal boundary (where the money has been spent and to be spent over the 2025 MTEF). Budget allocations are made as per prevalence of diseases and estimated population numbers per municipality. Alfred Nzo district is the only district municipality receiving more than 10 per cent of allocation. 178
