
Page 522 - Demo
P. 522
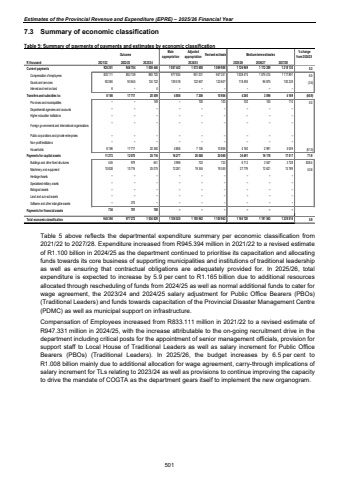
Estimates of the Provincial Revenue and Expenditure (EPRE) %u2013 2025/26 Financial Year7.3 Summary of economic classification Table 5: Summary of payments of payments and estimates by economic classification Outcome Main appropriationAdjusted appropriation Revised estimate Medium-term estimates % change from 2024/25R thousand 2021/22 2022/23 2023/24 2025/26 2026/27 2027/28Current payments 946 784 925 201 1 008 446 1 087 442 1 073 688 1 069 988 1 126 969 1 172 289 1 218 130 5.3Compensation of employees 853 139 833 111 883 720 977 924 951 031 947 331 1 008 474 1 075 414 1 117 891 6.5Goods and services 93 645 92 084 124 722 109 518 122 657 122 657 118 495 96 875 100 239 (3.4)Interest and rent on land %u2013 6 4 %u2013 %u2013 %u2013 %u2013 %u2013 %u2013 Transfers and subsidies to: 17 717 8 186 20 509 4 806 7 206 10 906 4 260 3 096 4 169 (60.9)Provinces and municipalities %u2013 %u2013 149 %u2013 100 100 100 105 110 0.0Departmental agencies and accounts %u2013 %u2013 %u2013 %u2013 %u2013 %u2013 %u2013 %u2013 %u2013 Higher education institutions %u2013 %u2013 %u2013 %u2013 %u2013 %u2013 %u2013 %u2013 %u2013Foreign governments and international organisations %u2013 %u2013 %u2013 %u2013 %u2013 %u2013 %u2013 %u2013 %u2013Public corporations and private enterprises %u2013 %u2013 %u2013 %u2013 %u2013 %u2013 %u2013 %u2013 %u2013Non-profit institutions %u2013 %u2013 %u2013 %u2013 %u2013 %u2013 %u2013 %u2013 %u2013Households 8 186 17 717 20 360 4 806 7 106 10 806 4 160 2 991 4 059 (61.5)Payments for capital assets 11 273 12 070 25 716 16 277 20 068 20 068 34 491 16 178 17 517 71.9Buildings and other fixed structures 445 979 641 3 996 723 723 6 712 3 557 3 728 828.4Machinery and equipment 10 828 10 716 25 075 12 281 19 345 19 345 27 779 12 621 13 789 43.6Heritage Assets %u2013 %u2013 %u2013 %u2013 %u2013 %u2013 %u2013 %u2013 %u2013Specialised military assets %u2013 %u2013 %u2013 %u2013 %u2013 %u2013 %u2013 %u2013 %u2013Biological assets %u2013 %u2013 %u2013 %u2013 %u2013 %u2013 %u2013 %u2013 %u2013Land and sub-soil assets %u2013 %u2013 %u2013 %u2013 %u2013 %u2013 %u2013 %u2013 %u2013Software and other intangible assets %u2013 375 %u2013 %u2013 %u2013 %u2013 %u2013 %u2013 %u2013Payments for financial assets 734 701 158 %u2013 %u2013 %u2013 %u2013 %u2013 %u2013Total economic classification 945 394 977 272 1 054 829 1 108 525 1 100 962 1 100 962 1 165 720 1 191 563 1 239 816 5.92024/25Table 5 above reflects the departmental expenditure summary per economic classification from 2021/22 to 2027/28. Expenditure increased from R945.394 million in 2021/22 to a revised estimate of R1.100 billion in 2024/25 as the department continued to prioritise its capacitation and allocating funds towards its core business of supporting municipalities and institutions of traditional leadership as well as ensuring that contractual obligations are adequately provided for. In 2025/26, total expenditure is expected to increase by 5.9 per cent to R1.165 billion due to additional resources allocated through rescheduling of funds from 2024/25 as well as normal additional funds to cater for wage agreement, the 2023/24 and 2024/25 salary adjustment for Public Office Bearers (PBOs) (Traditional Leaders) and funds towards capacitation of the Provincial Disaster Management Centre (PDMC) as well as municipal support on infrastructure. Compensation of Employees increased from R833.111 million in 2021/22 to a revised estimate of R947.331 million in 2024/25, with the increase attributable to the on-going recruitment drive in the department including critical posts for the appointment of senior management officials, provision for support staff to Local House of Traditional Leaders as well as salary increment for Public Office Bearers (PBOs) (Traditional Leaders). In 2025/26, the budget increases by 6.5 per cent to R1.008 billion mainly due to additional allocation for wage agreement, carry-through implications of salary increment for TLs relating to 2023/24 as well as provisions to continue improving the capacity to drive the mandate of COGTA as the department gears itself to implement the new organogram. 501
