
Page 526 - Demo
P. 526
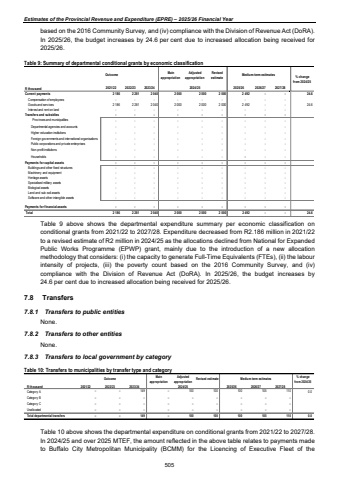
Estimates of the Provincial Revenue and Expenditure (EPRE) %u2013 2025/26 Financial Yearbased on the 2016 Community Survey, and (iv) compliance with the Division of Revenue Act (DoRA). In 2025/26, the budget increases by 24.6 per cent due to increased allocation being received for 2025/26. Table 9: Summary of departmental conditional grants by economic classification Outcome Mainappropriation Adjusted appropriation Revised estimate 2021/22 2022/23 2023/24 2024/25 2025/26 2026/27 2027/28 2 186 2 281 2 040 2 000 2 000 2 000 2 492 - - 24.6 - - - - - - - - - 2 186 2 281 2 040 2 000 2 000 2 000 2 492 - - 24.6 - - - - - - - - - Transfers and subsidies - - - - - - - - - Provinces and municipalities - - - - - - - - - Departmental agencies and accounts - - - - - - - - - Higher education institutions - - - - - - - - - Foreign governments and international organisations - - - - - - - - - Public corporations and private enterprises - - - - - - - - - Non-profit institutions - - - - - - - - - Households - - - - - - - - - - - - - - - - - - - - - - - - - - - - - - - - - - - - - - - - - - - - - - - - - - - - - - - - - - - - - - - - - - - - - - - - - - - - - - - - - - - - - - - - - - 2 186 2 281 2 040 2 000 2 000 2 000 2 492 - - 24.6 Interest and rent on landGoods and services % change from 2024/25 Current paymentsCompensation of employees TotalBiological assetsPayments for capital assetsBuildings and other fixed structuresMachinery and equipmentHeritage assetsSpecialised military assetsLand and sub-soil assetsSoftware and other intangible assetsPayments for financial assetsR thousandMedium-term estimatesTable 9 above shows the departmental expenditure summary per economic classification on conditional grants from 2021/22 to 2027/28. Expenditure decreased from R2.186 million in 2021/22 to a revised estimate of R2 million in 2024/25 as the allocations declined from National for Expanded Public Works Programme (EPWP) grant, mainly due to the introduction of a new allocation methodology that considers: (i) the capacity to generate Full-Time Equivalents (FTEs), (ii) the labour intensity of projects, (iii) the poverty count based on the 2016 Community Survey, and (iv) compliance with the Division of Revenue Act (DoRA). In 2025/26, the budget increases by 24.6 per cent due to increased allocation being received for 2025/26. 7.8 Transfers 7.8.1 Transfers to public entities None. 7.8.2 Transfers to other entities None. 7.8.3 Transfers to local government by category Table 10: Transfers to municipalities by transfer type and category Outcome Main appropriationAdjusted appropriation Revised estimate Medium-term estimates % change from 2024/25R thousand 2021/22 2022/23 2023/24 2025/26 2026/27 2027/28Category A %u2013 %u2013 149 %u2013 100 100 100 105 110 0.0Category B %u2013 %u2013 %u2013 %u2013 %u2013 %u2013 %u2013 %u2013 %u2013 Category C %u2013 %u2013 %u2013 %u2013 %u2013 %u2013 %u2013 %u2013 %u2013 Unallocated %u2013 %u2013 %u2013 %u2013 %u2013 %u2013 %u2013 %u2013 %u2013 Total departmental transfers %u2013 %u2013 149 %u2013 100 100 100 105 110 0.02024/25Table 10 above shows the departmental expenditure on conditional grants from 2021/22 to 2027/28. In 2024/25 and over 2025 MTEF, the amount reflected in the above table relates to payments made to Buffalo City Metropolitan Municipality (BCMM) for the Licencing of Executive Fleet of the 505
