
Page 524 - Demo
P. 524
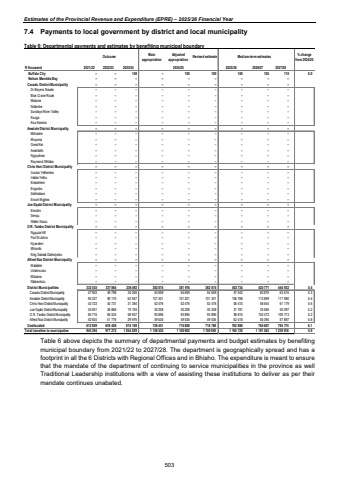
Estimates of the Provincial Revenue and Expenditure (EPRE) %u2013 2025/26 Financial Year7.4 Payments to local government by district and local municipality Table 6: Departmental payments and estimates by benefiting municipal boundary Outcome Main appropriationAdjusted appropriation Revised estimate Medium-term estimates % change from 2024/25R thousand 2021/22 2022/23 2023/24 2025/26 2026/27 2027/28 Buffalo City %u2013 %u2013 149 %u2013 100 100 100 105 110 0.0 Nelson Mandela Bay %u2013 %u2013 %u2013 %u2013 %u2013 %u2013 %u2013 %u2013 %u2013 Cacadu District Municipality %u2013 %u2013 %u2013 %u2013 %u2013 %u2013 %u2013 %u2013 %u2013 Dr Beyers Naude %u2013 %u2013 %u2013 %u2013 %u2013 %u2013 %u2013 %u2013 %u2013 Blue Crane Route %u2013 %u2013 %u2013 %u2013 %u2013 %u2013 %u2013 %u2013 %u2013 Makana %u2013 %u2013 %u2013 %u2013 %u2013 %u2013 %u2013 %u2013 %u2013 Ndlambe %u2013 %u2013 %u2013 %u2013 %u2013 %u2013 %u2013 %u2013 %u2013 Sundays River Valley %u2013 %u2013 %u2013 %u2013 %u2013 %u2013 %u2013 %u2013 %u2013 Kouga %u2013 %u2013 %u2013 %u2013 %u2013 %u2013 %u2013 %u2013 %u2013 Kou-Kamma %u2013 %u2013 %u2013 %u2013 %u2013 %u2013 %u2013 %u2013 %u2013 Amatole District Municipality %u2013 %u2013 %u2013 %u2013 %u2013 %u2013 %u2013 %u2013 %u2013 Mbhashe %u2013 %u2013 %u2013 %u2013 %u2013 %u2013 %u2013 %u2013 %u2013 Mnquma %u2013 %u2013 %u2013 %u2013 %u2013 %u2013 %u2013 %u2013 %u2013 Great Kei %u2013 %u2013 %u2013 %u2013 %u2013 %u2013 %u2013 %u2013 %u2013 Amahlathi %u2013 %u2013 %u2013 %u2013 %u2013 %u2013 %u2013 %u2013 %u2013 Ngqushwa %u2013 %u2013 %u2013 %u2013 %u2013 %u2013 %u2013 %u2013 %u2013 Raymond Mhlaba %u2013 %u2013 %u2013 %u2013 %u2013 %u2013 %u2013 %u2013 %u2013 Chris Hani District Municipality %u2013 %u2013 %u2013 %u2013 %u2013 %u2013 %u2013 %u2013 %u2013 Inxuba Yethemba %u2013 %u2013 %u2013 %u2013 %u2013 %u2013 %u2013 %u2013 %u2013 Intsika Yethu %u2013 %u2013 %u2013 %u2013 %u2013 %u2013 %u2013 %u2013 %u2013 Emalahleni %u2013 %u2013 %u2013 %u2013 %u2013 %u2013 %u2013 %u2013 %u2013 Engcobo %u2013 %u2013 %u2013 %u2013 %u2013 %u2013 %u2013 %u2013 %u2013 Sakhisizwe %u2013 %u2013 %u2013 %u2013 %u2013 %u2013 %u2013 %u2013 %u2013 Enoch Mgijima %u2013 %u2013 %u2013 %u2013 %u2013 %u2013 %u2013 %u2013 %u2013 Joe Gqabi District Municipality %u2013 %u2013 %u2013 %u2013 %u2013 %u2013 %u2013 %u2013 %u2013 Elundini %u2013 %u2013 %u2013 %u2013 %u2013 %u2013 %u2013 %u2013 %u2013 Senqu %u2013 %u2013 %u2013 %u2013 %u2013 %u2013 %u2013 %u2013 %u2013 Walter Sisulu %u2013 %u2013 %u2013 %u2013 %u2013 %u2013 %u2013 %u2013 %u2013 O.R. Tambo District Municipality %u2013 %u2013 %u2013 %u2013 %u2013 %u2013 %u2013 %u2013 %u2013 Ngquza Hill %u2013 %u2013 %u2013 %u2013 %u2013 %u2013 %u2013 %u2013 %u2013 Port St Johns %u2013 %u2013 %u2013 %u2013 %u2013 %u2013 %u2013 %u2013 %u2013 Nyandeni %u2013 %u2013 %u2013 %u2013 %u2013 %u2013 %u2013 %u2013 %u2013 Mhlontlo %u2013 %u2013 %u2013 %u2013 %u2013 %u2013 %u2013 %u2013 %u2013 King Sabata Dalindyebo %u2013 %u2013 %u2013 %u2013 %u2013 %u2013 %u2013 %u2013 %u2013 Alfred Nzo District Municipality %u2013 %u2013 %u2013 %u2013 %u2013 %u2013 %u2013 %u2013 %u2013 Matatiele %u2013 %u2013 %u2013 %u2013 %u2013 %u2013 %u2013 %u2013 %u2013 Umzimvubu %u2013 %u2013 %u2013 %u2013 %u2013 %u2013 %u2013 %u2013 %u2013 Mbizana %u2013 %u2013 %u2013 %u2013 %u2013 %u2013 %u2013 %u2013 %u2013 Ntabankulu %u2013 %u2013 %u2013 %u2013 %u2013 %u2013 %u2013 %u2013 %u2013 District Municipalities 332 535 337 864 236 492 382 074 381 974 382 074 402 734 425 771 444 932 5.4Cacadu District Municipality 47 903 49 798 34 055 54 659 54 659 54 659 57 542 60 876 63 616 5.3Amatole District Municipality 90 327 90 170 62 947 101 301 101 201 101 301 106 768 112 899 117 980 5.4Chris Hani District Municipality 43 723 44 731 31 384 52 476 52 476 52 476 55 410 58 544 61 179 5.6Joe Gqabi District Municipality 24 941 26 866 19 193 30 208 30 208 30 208 31 781 33 585 35 097 5.2O.R. Tambo District Municipality 84 716 84 524 58 937 93 896 93 896 93 896 98 815 104 472 109 173 5.2Alfred Nzo District Municipality 40 924 41 776 29 976 49 535 49 535 49 535 52 418 55 394 57 887 5.8Unallocated 612 859 639 408 818 188 726 451 718 888 718 788 762 886 765 687 794 774 6.1Total transfers to municipalies 945 394 1 054 829 977 272 1 108 525 1 100 962 1 100 962 1 165 720 1 191 563 1 239 816 5.92024/25Table 6 above depicts the summary of departmental payments and budget estimates by benefiting municipal boundary from 2021/22 to 2027/28. The department is geographically spread and has a footprint in all the 6 Districts with Regional Offices and in Bhisho. The expenditure is meant to ensure that the mandate of the department of continuing to service municipalities in the province as well Traditional Leadership institutions with a view of assisting these institutions to deliver as per their mandate continues unabated. 503
