
Page 567 - Demo
P. 567
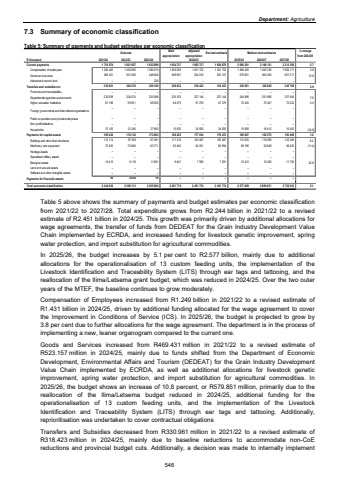
Department: Agriculture7.3 Summary of economic classification Table 5: Summary of payments and budget estimates per economic classification Outcome Main appropriationAdjusted appropriation Revised estimate Medium-term estimates % change from 2024/25R thousand 2021/22 2022/23 2023/24 2025/26 2026/27 2027/28Current payments 1 821 957 1 718 874 1 832 899 1 954 737 1 955 737 1 954 879 2 066 281 2 148 131 2 213 388 5.7Compensation of employees 1 300 892 1 249 443 1 384 015 1 456 056 1 431 722 1 431 722 1 486 430 1 543 746 1 606 171 3.8Goods and services 521 065 469 431 448 648 498 681 524 015 523 157 579 851 604 385 607 217 10.8Interest and rent on land %u2013 %u2013 236 %u2013 %u2013 %u2013 %u2013 %u2013 %u2013 Transfers and subsidies to: 304 370 330 961 329 106 308 832 318 423 318 423 330 921 338 945 345 768 3.9Provinces and municipalities %u2013 %u2013 %u2013 %u2013 %u2013 %u2013 %u2013 %u2013 %u2013 Departmental agencies and accounts 224 074 232 608 235 088 229 353 227 144 227 144 244 986 251 986 257 846 7.9Higher education institutions 59 051 61 198 66 035 64 479 67 279 67 279 70 245 70 547 72 522 4.4Foreign governments and international organisations %u2013 %u2013 %u2013 %u2013 %u2013 %u2013 %u2013 %u2013 %u2013Public corporations and private enterprises %u2013 %u2013 %u2013 %u2013 %u2013 %u2013 %u2013 %u2013 %u2013Non-profit institutions %u2013 %u2013 %u2013 %u2013 %u2013 %u2013 %u2013 %u2013 %u2013Households 37 155 21 245 27 983 15 000 24 000 24 000 15 690 16 412 15 400 (34.6)Payments for capital assets 195 026 174 132 173 063 188 205 177 614 178 472 180 607 182 575 193 466 1.2Buildings and other fixed structures 110 114 97 168 97 491 117 318 105 487 105 487 112 005 119 296 133 266 6.2Machinery and equipment 70 493 70 846 63 771 62 440 64 201 65 694 58 190 52 849 48 450 (11.4)Heritage Assets %u2013 %u2013 %u2013 %u2013 %u2013 %u2013 %u2013 %u2013 %u2013Specialised military assets %u2013 %u2013 %u2013 %u2013 %u2013 %u2013 %u2013 %u2013 %u2013Biological assets 14 419 6 118 11 801 8 447 7 926 7 291 10 412 10 430 11 750 42.8Land and sub-soil assets %u2013 %u2013 %u2013 %u2013 %u2013 %u2013 %u2013 %u2013 %u2013Software and other intangible assets %u2013 %u2013 %u2013 %u2013 %u2013 %u2013 %u2013 %u2013 %u2013Payments for financial assets 59 4 654 16 %u2013 %u2013 %u2013 %u2013 %u2013 %u2013Total economic classification 2 244 920 2 305 113 2 335 084 2 451 774 2 451 774 2 451 774 2 577 809 2 669 651 2 752 622 5.12024/25Table 5 above shows the summary of payments and budget estimates per economic classification from 2021/22 to 2027/28. Total expenditure grows from R2.244 billion in 2021/22 to a revised estimate of R2.451 billion in 2024/25. This growth was primarily driven by additional allocations for wage agreements, the transfer of funds from DEDEAT for the Grain Industry Development Value Chain implemented by ECRDA, and increased funding for livestock genetic improvement, spring water protection, and import substitution for agricultural commodities. In 2025/26, the budget increases by 5.1 per cent to R2.577 billion, mainly due to additional allocations for the operationalisation of 13 custom feeding units, the implementation of the Livestock Identification and Traceability System (LITS) through ear tags and tattooing, and the reallocation of the Ilima/Letsema grant budget, which was reduced in 2024/25. Over the two outer years of the MTEF, the baseline continues to grow moderately. Compensation of Employees increased from R1.249 billion in 2021/22 to a revised estimate of R1.431 billion in 2024/25, driven by additional funding allocated for the wage agreement to cover the Improvement in Conditions of Service (ICS). In 2025/26, the budget is projected to grow by 3.8 per cent due to further allocations for the wage agreement. The department is in the process of implementing a new, leaner organogram compared to the current one. Goods and Services increased from R469.431 million in 2021/22 to a revised estimate of R523.157 million in 2024/25, mainly due to funds shifted from the Department of Economic Development, Environmental Affairs and Tourism (DEDEAT) for the Grain Industry Development Value Chain implemented by ECRDA, as well as additional allocations for livestock genetic improvement, spring water protection, and import substitution for agricultural commodities. In 2025/26, the budget shows an increase of 10.8 percent, or R579.851 million, primarily due to the reallocation of the Ilima/Letsema budget reduced in 2024/25, additional funding for the operationalisation of 13 custom feeding units, and the implementation of the Livestock Identification and Traceability System (LITS) through ear tags and tattooing. Additionally, reprioritisation was undertaken to cover contractual obligations Transfers and Subsidies decreased from R330.961 million in 2021/22 to a revised estimate of R318.423 million in 2024/25, mainly due to baseline reductions to accommodate non-CoE reductions and provincial budget cuts. Additionally, a decision was made to internally implement 546
