
Page 568 - Demo
P. 568
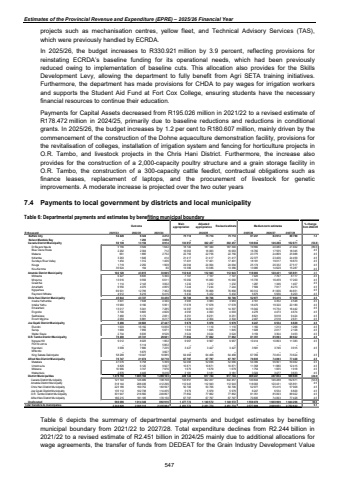
Estimates of the Provincial Revenue and Expenditure (EPRE) %u2013 2025/26 Financial Yearprojects such as mechanisation centres, yellow fleet, and Technical Advisory Services (TAS), which were previously handled by ECRDA. In 2025/26, the budget increases to R330.921 million by 3.9 percent, reflecting provisions for reinstating ECRDA%u2019s baseline funding for its operational needs, which had been previously reduced owing to implementation of baseline cuts. This allocation also provides for the Skills Development Levy, allowing the department to fully benefit from Agri SETA training initiatives. Furthermore, the department has made provisions for CHDA to pay wages for irrigation workers and supports the Student Aid Fund at Fort Cox College, ensuring students have the necessary financial resources to continue their education. Payments for Capital Assets decreased from R195.026 million in 2021/22 to a revised estimate of R178.472 million in 2024/25, primarily due to baseline reductions and reductions in conditional grants. In 2025/26, the budget increases by 1.2 per cent to R180.607 million, mainly driven by the commencement of the construction of the Dohne aquaculture demonstration facility, provisions for the revitalisation of colleges, installation of irrigation system and fencing for horticulture projects in O.R. Tambo, and livestock projects in the Chris Hani District. Furthermore, the increase also provides for the construction of a 2,000-capacity poultry structure and a grain storage facility in O.R. Tambo, the construction of a 300-capacity cattle feedlot, contractual obligations such as finance leases, replacement of laptops, and the procurement of livestock for genetic improvements. A moderate increase is projected over the two outer years 7.4 Payments to local government by districts and local municipality Table 6: Departmental payments and estimates by benefiting municipal boundary Outcome Main appropriationAdjusted appropriation Revised estimate Medium-term estimates % change from 2024/25R thousand 2021/22 2022/23 2023/24 2025/26 2026/27 2027/28 Buffalo City 6 324 54 428 4 272 75 714 75 714 75 714 81 237 84 974 88 798 7.3 Nelson Mandela Bay 1 293 %u2013 3 058 %u2013 %u2013 %u2013 %u2013 %u2013 %u2013 Cacadu District Municipality 13 150 50 139 8 914 133 857 302 457 302 457 139 834 146 288 152 871 (53.8) Dr Beyers Naude 3 549 5 156 1 642 18 740 187 340 187 340 19 560 20 480 21 402 (89.6) Blue Crane Route 2 304 2 262 712 16 063 16 063 16 063 16 782 17 555 18 345 4.5 Makana 1 895 661 2 752 22 756 22 756 22 756 23 775 24 869 25 988 4.5 Ndlambe 1 646 3 263 414 21 417 21 417 21 417 22 377 23 406 24 459 4.5 Sundays River Valley 1 312 1 454 1 406 17 401 17 401 17 401 18 181 19 017 19 873 4.5 Kouga 2 250 1 719 1 908 24 094 24 094 24 094 25 174 26 332 27 517 4.5 Kou-Kamma 194 35 624 80 13 386 13 386 13 386 13 985 14 629 15 287 4.5Amatole District Municipality 43 615 102 120 33 605 112 943 112 943 112 943 118 003 120 431 125 851 4.5 Mbhashe 8 835 6 427 5 360 7 107 7 107 7 107 7 425 7 767 8 117 4.5 Mnquma 9 556 13 616 6 611 15 060 15 060 15 060 15 735 16 459 17 200 4.5 Great Kei 2 143 1 114 3 002 1 232 1 232 1 232 1 287 1 346 1 407 4.5 Amahlathi 4 070 6 550 4 855 7 244 7 244 7 244 7 569 7 917 8 273 4.5 Ngqushwa 12 795 69 501 7 362 76 868 76 868 76 868 80 312 81 006 84 651 4.5 Raymond Mhlaba 6 216 4 912 6 415 5 432 5 432 5 432 5 675 5 936 6 203 4.5Chris Hani District Municipality 43 727 45 844 33 450 50 706 50 706 50 706 52 977 55 415 57 908 4.5 Inxuba Yethemba 3 601 7 638 4 340 3 983 3 983 3 983 4 161 4 352 4 548 4.5 Intsika Yethu 15 983 9 190 5 951 17 678 17 678 17 678 18 470 19 320 20 189 4.5 Emalahleni 13 017 5 041 7 285 14 397 14 397 14 397 15 042 15 734 16 442 4.5 Engcobo 9 805 3 700 4 826 4 093 4 093 4 093 4 276 4 473 4 674 4.5 Sakhisizwe 5 172 7 460 2 831 8 251 8 251 8 251 8 621 9 018 9 424 4.5 Enoch Mgijima 6 881 2 083 8 217 2 304 2 304 2 304 2 407 2 518 2 631 4.5Joe Gqabi District Municipality 30 683 5 406 27 447 5 979 5 979 5 979 6 247 6 534 6 829 4.5 Elundini 16 192 1 003 13 050 1 110 1 110 1 110 1 160 1 213 1 268 4.5 Senqu 7 856 1 669 5 871 1 845 1 845 1 845 1 928 2 017 2 108 4.5 Walter Sisulu 6 635 2 734 8 526 3 024 3 024 3 024 3 159 3 304 3 453 4.5O.R. Tambo District Municipality 45 741 70 400 29 601 77 862 77 862 77 862 81 351 85 093 88 922 4.5 Ngquza Hill 8 025 9 012 1 802 9 967 9 967 9 967 10 414 10 893 11 383 4.5 Port St Johns %u2013 5 114 5 852 %u2013 %u2013 %u2013 %u2013 %u2013 %u2013 Nyandeni 7 880 3 099 7 235 3 427 3 427 3 427 3 581 3 746 3 915 4.5 Mhlontlo %u2013 5 675 3 827 %u2013 %u2013 %u2013 %u2013 %u2013 %u2013 King Sabata Dalindyebo 19 047 58 289 10 885 64 468 64 468 64 468 67 356 70 454 73 624 4.5Alfred Nzo District Municipality 21 074 70 747 32 718 67 797 67 797 67 797 70 835 74 093 77 428 4.5 Matatiele 47 076 6 758 5 399 52 066 52 066 52 066 54 399 56 901 59 462 4.5 Umzimvubu 9 829 6 120 9 927 10 871 10 871 10 871 11 358 11 880 12 415 4.5 Mbizana 10 966 3 747 7 976 1 679 1 679 1 679 1 754 1 835 1 918 4.5 Ntabankulu 2 876 4 449 9 416 3 181 3 181 3 181 3 324 3 477 3 633 4.5District Municipalities 1 085 160 1 279 750 1 269 103 449 144 617 744 617 744 469 247 487 854 509 809 (24.0)Cacadu District Municipality 126 489 121 143 138 708 133 857 302 457 302 457 139 834 146 288 152 871 (53.8)Amatole District Municipality 288 436 318 144 412 296 112 943 112 943 112 943 118 003 120 431 125 851 4.5Chris Hani District Municipality 169 752 223 189 183 597 50 706 50 706 50 706 52 977 55 415 57 908 4.5Joe Gqabi District Municipality 102 738 135 112 114 455 5 979 5 979 5 979 6 247 6 534 6 829 4.5O.R. Tambo District Municipality 216 560 301 947 249 897 77 862 77 862 77 862 81 351 85 093 88 922 4.5Alfred Nzo District Municipality 181 185 180 215 170 150 67 797 67 797 67 797 70 835 74 093 77 428 4.5Unallocated 1 014 346 566 086 892 916 1 477 772 1 140 572 1 140 572 1 558 078 1 608 969 1 644 206 36.6Total transfers to municipalies 2 305 113 2 244 920 2 335 084 2 451 774 2 451 774 2 451 774 2 577 809 2 669 651 2 752 622 5.12024/25 Table 6 depicts the summary of departmental payments and budget estimates by benefiting municipal boundary from 2021/22 to 2027/28. Total expenditure declines from R2.244 billion in 2021/22 to a revised estimate of R2.451 billion in 2024/25 mainly due to additional allocations for wage agreements, the transfer of funds from DEDEAT for the Grain Industry Development Value 547
