
Page 575 - Demo
P. 575
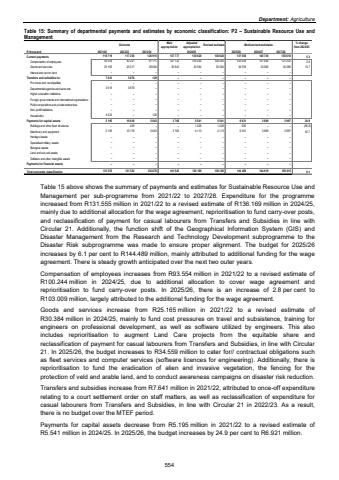
Department: AgricultureTable 15: Summary of departmental payments and estimates by economic classification: P2 %u2013 Sustainable Resource Use and Management Outcome Main appropriationAdjusted appropriation Revised estimate Medium-term estimates % change from 2024/25R thousand 2021/22 2022/23 2023/24 2025/26 2026/27 2027/28Current payments 117 238 118 719 126 915 137 777 130 628 130 628 137 568 140 730 155 618 5.3Compensation of employees 93 554 92 221 97 111 107 132 100 244 100 244 103 009 107 644 121 232 2.8Goods and services 25 165 25 017 29 804 30 645 30 384 30 384 34 559 33 086 34 386 13.7Interest and rent on land %u2013 %u2013 %u2013 %u2013 %u2013 %u2013 %u2013 %u2013 %u2013Transfers and subsidies to: 7 641 3 676 120 %u2013 %u2013 %u2013 %u2013 %u2013 %u2013Provinces and municipalities %u2013 %u2013 %u2013 %u2013 %u2013 %u2013 %u2013 %u2013 %u2013Departmental agencies and accounts 3 618 3 676 %u2013 %u2013 %u2013 %u2013 %u2013 %u2013 %u2013Higher education institutions %u2013 %u2013 %u2013 %u2013 %u2013 %u2013 %u2013 %u2013 %u2013Foreign governments and international organisations %u2013 %u2013 %u2013 %u2013 %u2013 %u2013 %u2013 %u2013 %u2013Public corporations and private enterprises %u2013 %u2013 %u2013 %u2013 %u2013 %u2013 %u2013 %u2013 %u2013Non-profit institutions %u2013 %u2013 %u2013 %u2013 %u2013 %u2013 %u2013 %u2013 %u2013Households 4 023 %u2013 120 %u2013 %u2013 %u2013 %u2013 %u2013 %u2013Payments for capital assets 5 195 10 618 5 843 3 768 5 541 5 541 6 921 3 889 3 997 24.9Buildings and other fixed structures %u2013 439 %u2013 %u2013 1 428 1 428 560 %u2013 %u2013 (60.8)Machinery and equipment 5 195 10 179 5 843 3 768 4 113 4 113 6 361 3 889 3 997 54.7Heritage Assets %u2013 %u2013 %u2013 %u2013 %u2013 %u2013 %u2013 %u2013 %u2013Specialised military assets %u2013 %u2013 %u2013 %u2013 %u2013 %u2013 %u2013 %u2013 %u2013Biological assets %u2013 %u2013 %u2013 %u2013 %u2013 %u2013 %u2013 %u2013 %u2013Land and sub-soil assets %u2013 %u2013 %u2013 %u2013 %u2013 %u2013 %u2013 %u2013 %u2013Software and other intangible assets %u2013 %u2013 %u2013 %u2013 %u2013 %u2013 %u2013 %u2013 %u2013Payments for financial assets %u2013 %u2013 %u2013 %u2013 %u2013 %u2013 %u2013 %u2013 %u2013Total economic classification 131 555 131 532 132 878 141 545 136 169 136 169 144 489 144 619 159 615 6.12024/25Table 15 above shows the summary of payments and estimates for Sustainable Resource Use and Management per sub-programme from 2021/22 to 2027/28. Expenditure for the programme increased from R131.555 million in 2021/22 to a revised estimate of R136.169 million in 2024/25, mainly due to additional allocation for the wage agreement, reprioritisation to fund carry-over posts, and reclassification of payment for casual labourers from Transfers and Subsidies in line with Circular 21. Additionally, the function shift of the Geographical Information System (GIS) and Disaster Management from the Research and Technology Development subprogramme to the Disaster Risk subprogramme was made to ensure proper alignment. The budget for 2025/26 increases by 6.1 per cent to R144.489 million, mainly attributed to additional funding for the wage agreement. There is steady growth anticipated over the next two outer years. Compensation of employees increases from R93.554 million in 2021/22 to a revised estimate of R100.244 million in 2024/25, due to additional allocation to cover wage agreement and reprioritisation to fund carry-over posts. In 2025/26, there is an increase of 2.8 per cent to R103.009 million, largely attributed to the additional funding for the wage agreement. Goods and services increase from R25.165 million in 2021/22 to a revised estimate of R30.384 million in 2024/25, mainly to fund cost pressures on travel and subsistence, training for engineers on professional development, as well as software utilized by engineers. This also includes reprioritisation to augment Land Care projects from the equitable share and reclassification of payment for casual labourers from Transfers and Subsidies, in line with Circular 21. In 2025/26, the budget increases to R34.559 million to cater for// contractual obligations such as fleet services and computer services (software licences for engineering). Additionally, there is reprioritisation to fund the eradication of alien and invasive vegetation, the fencing for the protection of veld and arable land, and to conduct awareness campaigns on disaster risk reduction. Transfers and subsidies increase from R7.641 million in 2021/22, attributed to once-off expenditure relating to a court settlement order on staff matters, as well as reclassification of expenditure for casual labourers from Transfers and Subsidies, in line with Circular 21 in 2022/23. As a result, there is no budget over the MTEF period. Payments for capital assets decrease from R5.195 million in 2021/22 to a revised estimate of R5.541 million in 2024/25. In 2025/26, the budget increases by 24.9 per cent to R6.921 million. 554
