
Page 573 - Demo
P. 573
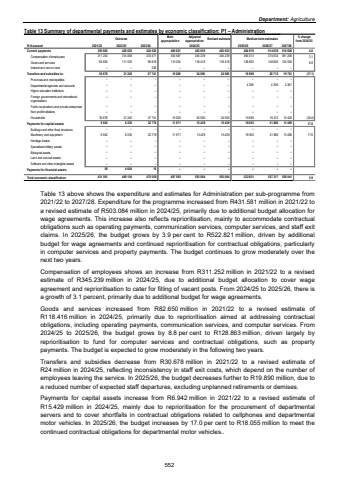
Department: AgricultureTable 13 Summary of departmental payments and estimates by economic classification: P1 %u2013 Administration Outcome Main appropriationAdjusted appropriation Revised estimate Medium-term estimates % change from 2024/25R thousand 2021/22 2022/23 2023/24 2025/26 2026/27 2027/28Current payments 426 025 393 902 424 525 460 621 463 655 463 655 484 876 514 639 516 800 4.6Compensation of employees 314 492 311 252 333 471 350 587 345 239 345 239 356 013 374 034 391 206 3.1Goods and services 111 533 82 650 90 818 110 034 118 416 118 416 128 863 140 605 125 594 8.8Interest and rent on land %u2013 %u2013 236 %u2013 %u2013 %u2013 %u2013 %u2013 %u2013 Transfers and subsidies to: 21 245 30 678 27 741 15 000 24 000 24 000 19 890 20 712 19 761 (17.1)Provinces and municipalities %u2013 %u2013 %u2013 %u2013 %u2013 %u2013 %u2013 %u2013 %u2013 Departmental agencies and accounts %u2013 %u2013 %u2013 %u2013 %u2013 %u2013 4 200 4 300 4 361 Higher education institutions %u2013 %u2013 %u2013 %u2013 %u2013 %u2013 %u2013 %u2013 %u2013 Foreign governments and international organisations %u2013 %u2013 %u2013 %u2013 %u2013 %u2013 %u2013 %u2013 %u2013 Public corporations and private enterprises %u2013 %u2013 %u2013 %u2013 %u2013 %u2013 %u2013 %u2013 %u2013 Non-profit institutions %u2013 %u2013 %u2013 %u2013 %u2013 %u2013 %u2013 %u2013 %u2013 Households 30 678 21 245 27 741 15 000 24 000 24 000 15 690 15 400 16 412 (34.6)Payments for capital assets 6 942 8 230 22 776 11 971 15 429 15 429 18 055 13 480 21 866 17.0Buildings and other fixed structures %u2013 %u2013 %u2013 %u2013 %u2013 %u2013 %u2013 %u2013 %u2013 Machinery and equipment 6 942 8 230 22 776 11 971 15 429 15 429 18 055 13 480 21 866 17.0Heritage Assets %u2013 %u2013 %u2013 %u2013 %u2013 %u2013 %u2013 %u2013 %u2013 Specialised military assets %u2013 %u2013 %u2013 %u2013 %u2013 %u2013 %u2013 %u2013 %u2013 Biological assets %u2013 %u2013 %u2013 %u2013 %u2013 %u2013 %u2013 %u2013 %u2013 Land and sub-soil assets %u2013 %u2013 %u2013 %u2013 %u2013 %u2013 %u2013 %u2013 %u2013 Software and other intangible assets %u2013 %u2013 %u2013 %u2013 %u2013 %u2013 %u2013 %u2013 %u2013 Payments for financial assets 59 4 654 16 %u2013 %u2013 %u2013 %u2013 %u2013 %u2013 Total economic classification 431 581 460 154 475 058 487 592 503 084 503 084 522 821 550 041 557 217 3.92024/25Table 13 above shows the expenditure and estimates for Administration per sub-programme from 2021/22 to 2027/28. Expenditure for the programme increased from R431.581 million in 2021/22 to a revised estimate of R503.084 million in 2024/25, primarily due to additional budget allocation for wage agreements. This increase also reflects reprioritisation, mainly to accommodate contractual obligations such as operating payments, communication services, computer services, and staff exit claims. In 2025/26, the budget grows by 3.9 per cent to R522.821 million, driven by additional budget for wage agreements and continued reprioritisation for contractual obligations, particularly in computer services and property payments. The budget continues to grow moderately over the next two years. Compensation of employees shows an increase from R311.252 million in 2021/22 to a revised estimate of R345.239 million in 2024/25, due to additional budget allocation to cover wage agreement and reprioritisation to cater for filling of vacant posts. From 2024/25 to 2025/26, there is a growth of 3.1 percent, primarily due to additional budget for wage agreements. Goods and services increased from R82.650 million in 2021/22 to a revised estimate of R118.416 million in 2024/25, primarily due to reprioritisation aimed at addressing contractual obligations, including operating payments, communication services, and computer services. From 2024/25 to 2025/26, the budget grows by 8.8 per cent to R128.863 million, driven largely by reprioritisation to fund for computer services and contractual obligations, such as property payments. The budget is expected to grow moderately in the following two years. Transfers and subsidies decrease from R30.678 million in 2021/22 to a revised estimate of R24 million in 2024/25, reflecting inconsistency in staff exit costs, which depend on the number of employees leaving the service. In 2025/26, the budget decreases further to R19.890 million, due to a reduced number of expected staff departures, excluding unplanned retirements or demises. Payments for capital assets increase from R6.942 million in 2021/22 to a revised estimate of R15.429 million in 2024/25, mainly due to reprioritisation for the procurement of departmental servers and to cover shortfalls in contractual obligations related to cellphones and departmental motor vehicles. In 2025/26, the budget increases by 17.0 per cent to R18.055 million to meet the continued contractual obligations for departmental motor vehicles.. 552
