
Page 748 - Demo
P. 748
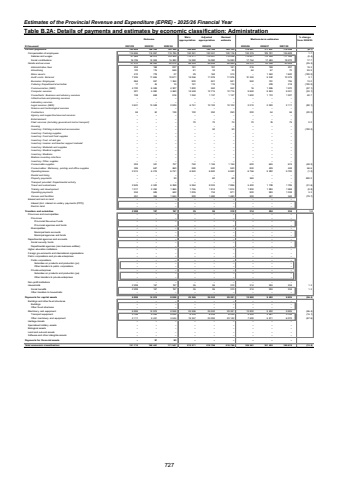
Estimates of the Provincial Revenue and Expenditure (EPRE) - 2025/26 Financial Year Table B.2A: Details of payments and estimates by economic classification: Administration Outcome Main appropriationAdjusted appropriationRevised estimate Medium-term estimates % change from 2024/25R thousand 2021/22 2022/23 2023/24 2025/26 2026/27 2027/28Current payments 142 605 169 320 162 299 186 640 189 169 189 105 176 447 171 827 179 556 (6.7)Compensation of employ ees 114 695 114 837 119 785 130 391 130 331 130 116 132 375 129 791 135 628 1.7Salaries and w ages 97 969 99 913 103 905 115 311 115 251 115 036 114 621 112 308 117 358 (0.4)Social contributions 16 726 14 924 15 880 15 080 15 080 15 080 17 754 17 483 18 270 17.7Goods and serv ices 27 910 54 483 42 514 56 249 58 838 58 989 44 072 42 036 43 928 (25.3)Administrative fees 204 168 207 181 181 181 216 198 207 19.3Advertising 122 115 569 61 33 33 64 67 70 93.9Minor assets 410 778 27 29 162 313 1 550 %u2013 1 620 (100.0)Audit costs: External 7 935 11 655 10 671 14 056 11 976 11 976 12 350 9 932 10 379 3.1Bursaries: Employees 864 937 1 264 900 841 841 950 761 795 13.0Catering: Departmental activities 17 45 10 191 119 119 %u2013 209 218 (100.0)Communication (G&S) 4 720 6 599 4 907 1 800 552 552 16 1 885 1 970 (97.1)Computer services 901 5 060 3 660 14 548 12 715 12 715 9 650 8 843 9 241 (24.1)Consultants: Business and advisory services 748 658 916 1 250 1 137 1 137 1 600 1 174 1 227 40.7Infrastructure and planning services %u2013 %u2013 %u2013 %u2013 %u2013 %u2013 %u2013 %u2013 %u2013Laboratory services %u2013 %u2013 %u2013 %u2013 %u2013 %u2013 %u2013 %u2013 %u2013Legal services (G&S) 3 631 13 538 2 009 6 751 10 102 10 102 2 010 2 020 2 111 (80.1)Science and technological services %u2013 %u2013 %u2013 %u2013 %u2013 %u2013 %u2013 %u2013 %u2013Contractors 84 50 128 100 250 250 200 54 56 (20.0)Agency and support/outsourced services %u2013 %u2013 %u2013 %u2013 %u2013 %u2013 %u2013 %u2013 %u2013Entertainment %u2013 %u2013 %u2013 %u2013 %u2013 %u2013 %u2013 %u2013 %u2013Fleet services (including government motor transport) %u2013 %u2013 %u2013 70 70 70 70 76 79 0.0Housing %u2013 %u2013 %u2013 %u2013 %u2013 %u2013 %u2013 %u2013 %u2013Inventory: Clothing material and accessories %u2013 %u2013 %u2013 %u2013 50 50 %u2013 %u2013 (100.0) %u2013Inventory: Farming supplies %u2013 %u2013 %u2013 %u2013 %u2013 %u2013 %u2013 %u2013 %u2013Inventory: Food and food supplies %u2013 %u2013 %u2013 %u2013 %u2013 %u2013 %u2013 %u2013 %u2013Inventory: Fuel, oil and gas %u2013 %u2013 %u2013 %u2013 %u2013 %u2013 %u2013 %u2013 %u2013Inventory: Learner and teacher support material %u2013 %u2013 %u2013 %u2013 %u2013 %u2013 %u2013 %u2013 %u2013Inventory: Materials and supplies %u2013 %u2013 %u2013 %u2013 %u2013 %u2013 %u2013 %u2013 %u2013Inventory: Medical supplies %u2013 %u2013 %u2013 %u2013 %u2013 %u2013 %u2013 %u2013 %u2013Inventory: Medicine %u2013 %u2013 %u2013 %u2013 %u2013 %u2013 %u2013 %u2013 %u2013Medsas inventory interface %u2013 %u2013 %u2013 %u2013 %u2013 %u2013 %u2013 %u2013 %u2013Inventory: Other supplies %u2013 %u2013 %u2013 %u2013 %u2013 %u2013 %u2013 %u2013 %u2013Consumable supplies 204 341 727 750 1 159 1 159 600 645 674 (48.2)Consumables: Stationery, printing and office supplies 306 647 660 398 530 530 830 429 448 56.6Operating leases 2 913 6 219 6 791 6 840 6 840 6 840 6 756 9 282 9 700 (1.2)Rental and hiring %u2013 %u2013 %u2013 %u2013 %u2013 %u2013 %u2013 %u2013 %u2013Property payments %u2013 %u2013 30 %u2013 60 60 360 %u2013 500.0 %u2013Transport provided: Departmental activity %u2013 %u2013 %u2013 %u2013 %u2013 %u2013 %u2013 %u2013 %u2013Travel and subsistence 2 649 4 522 6 068 5 264 8 033 7 896 5 400 1 708 1 785 (31.6)Training and development 1 017 2 250 1 665 1 755 1 814 1 814 1 800 1 883 1 968 (0.8)Operating payments 934 506 642 1 005 734 871 900 993 1 038 3.3Venues and facilities 251 394 1 563 300 1 480 1 480 300 327 342 (79.7)Interest and rent on land %u2013 %u2013 %u2013 %u2013 %u2013 %u2013 %u2013 %u2013 %u2013Interest (Incl. interest on unitary pay ments (PPP)) %u2013 %u2013 %u2013 %u2013 %u2013 %u2013 %u2013 %u2013 %u2013Rent on land %u2013 %u2013 %u2013 %u2013 %u2013 %u2013 %u2013 %u2013 %u2013Transfers and subsidies 2 208 157 197 35 95 310 314 224 234 1.3 Prov inces and municipalities %u2013 %u2013 %u2013 %u2013 %u2013 %u2013 %u2013 %u2013 %u2013Prov inces %u2013 %u2013 %u2013 %u2013 %u2013 %u2013 %u2013 %u2013 %u2013Prov incial Rev enue Funds %u2013 %u2013 %u2013 %u2013 %u2013 %u2013 %u2013 %u2013 %u2013Prov incial agencies and funds %u2013 %u2013 %u2013 %u2013 %u2013 %u2013 %u2013 %u2013 %u2013Municipalities %u2013 %u2013 %u2013 %u2013 %u2013 %u2013 %u2013 %u2013 %u2013Municipal bank accounts %u2013 %u2013 %u2013 %u2013 %u2013 %u2013 %u2013 %u2013 %u2013Municipal agencies and funds %u2013 %u2013 %u2013 %u2013 %u2013 %u2013 %u2013 %u2013 %u2013Departmental agencies and accounts %u2013 %u2013 %u2013 %u2013 %u2013 %u2013 %u2013 %u2013 %u2013Social security funds %u2013 %u2013 %u2013 %u2013 %u2013 %u2013 %u2013 %u2013 %u2013Departmental agencies (non-business entities) %u2013 %u2013 %u2013 %u2013 %u2013 %u2013 %u2013 %u2013 %u2013Higher education institutions %u2013 %u2013 %u2013 %u2013 %u2013 %u2013 %u2013 %u2013 %u2013Foreign gov ernments and international organisations %u2013 %u2013 %u2013 %u2013 %u2013 %u2013 %u2013 %u2013 %u2013Public corporations and priv ate enterprises %u2013 %u2013 %u2013 %u2013 %u2013 %u2013 %u2013 %u2013 %u2013Public corporations %u2013 %u2013 %u2013 %u2013 %u2013 %u2013 %u2013 %u2013 %u2013Subsidies on products and production (pc) %u2013 %u2013 %u2013 %u2013 %u2013 %u2013 %u2013 %u2013 %u2013Other transfers to public corporations %u2013 %u2013 %u2013 %u2013 %u2013 %u2013 %u2013 %u2013 %u2013Priv ate enterprises %u2013 %u2013 %u2013 %u2013 %u2013 %u2013 %u2013 %u2013 %u2013Subsidies on products and production (pe) %u2013 %u2013 %u2013 %u2013 %u2013 %u2013 %u2013 %u2013 %u2013Other transfers to priv ate enterprises %u2013 %u2013 %u2013 %u2013 %u2013 %u2013 %u2013 %u2013 %u2013Non-profit institutions %u2013 %u2013 %u2013 %u2013 %u2013 %u2013 %u2013 %u2013 %u2013Households 2 208 157 197 35 95 310 314 224 234 1.3Social benefits 2 208 157 197 35 95 310 314 224 234 1.3Other transfers to households %u2013 %u2013 %u2013 %u2013 %u2013 %u2013 %u2013 %u2013 %u2013Payments for capital assets 6 899 14 874 8 958 25 596 29 532 29 381 12 800 9 402 9 825 (56.4)Buildings and other fix ed structures %u2013 %u2013 %u2013 %u2013 %u2013 %u2013 %u2013 %u2013 %u2013Buildings %u2013 %u2013 %u2013 %u2013 %u2013 %u2013 %u2013 %u2013 %u2013Other fix ed structures %u2013 %u2013 %u2013 %u2013 %u2013 %u2013 %u2013 %u2013 %u2013Machinery and equipment 6 899 14 874 8 958 25 596 29 532 29 381 12 800 9 402 9 825 (56.4)Transport equipment 4 788 5 443 5 424 6 239 6 239 6 239 5 300 3 591 3 753 (15.1)Other machinery and equipment 2 111 9 431 3 534 19 357 23 293 23 142 7 500 5 811 6 072 (67.6)Heritage Assets %u2013 %u2013 %u2013 %u2013 %u2013 %u2013 %u2013 %u2013 %u2013Specialised military assets %u2013 %u2013 %u2013 %u2013 %u2013 %u2013 %u2013 %u2013 %u2013Biological assets %u2013 %u2013 %u2013 %u2013 %u2013 %u2013 %u2013 %u2013 %u2013Land and sub-soil assets %u2013 %u2013 %u2013 %u2013 %u2013 %u2013 %u2013 %u2013 %u2013Softw are and other intangible assets %u2013 %u2013 %u2013 %u2013 %u2013 %u2013 %u2013 %u2013 %u2013Payments for financial assets %u2013 91 93 %u2013 %u2013 %u2013 %u2013 %u2013 %u2013Total economic classification 151 712 184 441 171 547 212 271 218 796 218 796 189 561 181 453 189 615 (13.4)2024/25727
