
Page 742 - Demo
P. 742
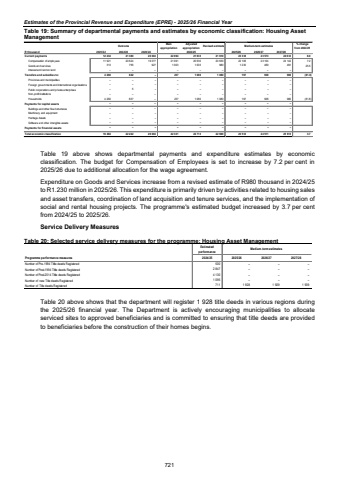
Estimates of the Provincial Revenue and Expenditure (EPRE) - 2025/26 Financial Year Table 19: Summary of departmental payments and estimates by economic classification: Housing Asset Management Outcome Main appropriationAdjusted appropriation Revised estimate Medium-term estimates % change from 2024/25R thousand 2021/22 2022/23 2023/24 2025/26 2026/27 2027/28Current payments 12 234 21 380 20 004 22 094 21 633 21 610 23 336 23 573 24 633 8.0Compensation of employees 11 921 20 624 19 077 21 091 20 630 20 630 22 106 23 104 24 142 7.2Goods and services 313 756 927 1 003 1 003 980 1 230 469 491 25.5Interest and rent on land %u2013 %u2013 %u2013 %u2013 %u2013 %u2013 %u2013 %u2013 %u2013Transfers and subsidies to: 4 260 842 %u2013 237 1 080 1 080 197 938 980 (81.8)Provinces and municipalities %u2013 %u2013 %u2013 %u2013 %u2013 %u2013 %u2013 %u2013 %u2013Foreign governments and international organisations %u2013 %u2013 %u2013 %u2013 %u2013 %u2013 %u2013 %u2013 %u2013Public corporations and private enterprises %u2013 5 %u2013 %u2013 %u2013 %u2013 %u2013 %u2013 %u2013Non-profit institutions %u2013 %u2013 %u2013 %u2013 %u2013 %u2013 %u2013 %u2013 %u2013Households 4 260 837 %u2013 237 1 080 1 080 197 938 980 (81.8)Payments for capital assets %u2013 %u2013 %u2013 %u2013 %u2013 %u2013 %u2013 %u2013 %u2013Buildings and other fixed structures %u2013 %u2013 %u2013 %u2013 %u2013 %u2013 %u2013 %u2013 %u2013Machinery and equipment %u2013 %u2013 %u2013 %u2013 %u2013 %u2013 %u2013 %u2013 %u2013Heritage Assets %u2013 %u2013 %u2013 %u2013 %u2013 %u2013 %u2013 %u2013 %u2013Software and other intangible assets %u2013 %u2013 %u2013 %u2013 %u2013 %u2013 %u2013 %u2013 %u2013Payments for financial assets %u2013 %u2013 %u2013 %u2013 %u2013 %u2013 %u2013 %u2013 %u2013Total economic classification 16 494 22 222 20 004 22 331 22 713 22 690 23 533 24 511 25 613 3.72024/25 Table 19 above shows departmental payments and expenditure estimates by economic classification. The budget for Compensation of Employees is set to increase by 7.2 per cent in 2025/26 due to additional allocation for the wage agreement. Expenditure on Goods and Services increase from a revised estimate of R980 thousand in 2024/25 to R1.230 million in 2025/26. This expenditure is primarily driven by activities related to housing sales and asset transfers, coordination of land acquisition and tenure services, and the implementation of social and rental housing projects. The programme's estimated budget increased by 3.7 per cent from 2024/25 to 2025/26. Service Delivery Measures Table 20: Selected service delivery measures for the programme: Housing Asset Management Estimatedperformance Medium-term estimatesProgramme performance measures 2024/25 2025/26 2026/27 2027/28Number of Pre-1994 Tittle deeds Registered %u2013 500 %u2013 %u2013 Number of Post-1994 Tittle deeds Registered %u2013 2 847 %u2013 %u2013 Number of Post-2014 Tittle deeds Registered %u2013 4 130 %u2013 %u2013 Number of new Title deeds Registered %u2013 1 095 %u2013 %u2013 Number of Title deeds Registered 1 928 711 1 929 1 939 Table 20 above shows that the department will register 1 928 title deeds in various regions during the 2025/26 financial year. The Department is actively encouraging municipalities to allocate serviced sites to approved beneficiaries and is committed to ensuring that title deeds are provided to beneficiaries before the construction of their homes begins. 721
