
Page 888 - Demo
P. 888
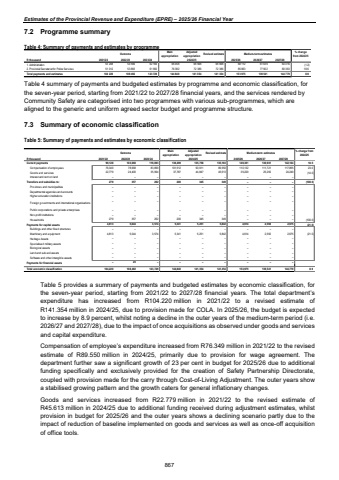
Estimates of the Provincial Revenue and Expenditure (EPRE) %u2013 2025/26 Financial Year7.2 Programme summary Table 4: Summary of payments and estimates by programmeOutcome Main appropriationAdjusted appropriation Revised estimate Medium-term estimates % change from 2024/25R thousand 2021/22 2022/23 2023/24 2025/26 2026/27 2027/281. Administration 53 208 54 599 62 169 68 458 68 968 68 968 68 112 61 639 64 416 (1.2)2. Provincial Secretariat for Police Services 51 012 53 893 61 560 76 382 72 386 72 386 85 863 77 902 80 363 18.6Total payments and estimates 104 220 108 492 123 729 144 840 141 354 141 354 153 975 139 541 144 779 8.92024/25Table 4 summary of payments and budgeted estimates by programme and economic classification, for the seven-year period, starting from 2021/22 to 2027/28 financial years, and the services rendered by Community Safety are categorised into two programmes with various sub-programmes, which are aligned to the generic and uniform agreed sector budget and programme structure. 7.3 Summary of economic classification Table 5: Summary of payments and estimates by economic classificationOutcome Main appropriationAdjusted appropriation Revised estimate Medium-term estimates % change from 2024/25R thousand 2021/22 2022/23 2023/24 2025/26 2026/27 2027/28Current payments 103,068 99,128 119,893 139,299 135,758 135,163 149,361 136,981 142,104 10.5Compensation of employees 78,668 76,349 83,899 101,512 90,911 89,550 110,132 111,721 117,855 23.0Goods and services 24,400 22,779 35,994 37,787 44,847 45,613 39,229 25,260 24,249 (14.0)Interest and rent on land %u2013 %u2013 %u2013 %u2013 %u2013 %u2013 %u2013 %u2013 %u2013 Transfers and subsidies to: 357 279 262 200 345 349 %u2013 %u2013 %u2013 (100.0)Provinces and municipalities %u2013 %u2013 %u2013 %u2013 %u2013 %u2013 %u2013 %u2013 %u2013 Departmental agencies and accounts %u2013 %u2013 %u2013 %u2013 %u2013 %u2013 %u2013 %u2013 %u2013Higher education institutions %u2013 %u2013 %u2013 %u2013 %u2013 %u2013 %u2013 %u2013 %u2013Foreign governments and international organisations %u2013 %u2013 %u2013 %u2013 %u2013 %u2013 %u2013 %u2013 %u2013Public corporations and private enterprises %u2013 %u2013 %u2013 %u2013 %u2013 %u2013 %u2013 %u2013 %u2013Non-profit institutions %u2013 %u2013 %u2013 %u2013 %u2013 %u2013 %u2013 %u2013 %u2013Households 279 357 262 200 345 349 %u2013 %u2013 %u2013 (100.0)Payments for capital assets 4,813 5,044 3,574 5,341 5,251 5,842 4,614 2,560 2,675 (21.0)Buildings and other fixed structures %u2013 %u2013 %u2013 %u2013 %u2013 %u2013 %u2013 %u2013 %u2013Machinery and equipment 4,813 5,044 3,574 5,341 5,251 5,842 4,614 2,560 2,675 (21.0)Heritage Assets %u2013 %u2013 %u2013 %u2013 %u2013 %u2013 %u2013 %u2013 %u2013Specialised military assets %u2013 %u2013 %u2013 %u2013 %u2013 %u2013 %u2013 %u2013 %u2013Biological assets %u2013 %u2013 %u2013 %u2013 %u2013 %u2013 %u2013 %u2013 %u2013Land and sub-soil assets %u2013 %u2013 %u2013 %u2013 %u2013 %u2013 %u2013 %u2013 %u2013Software and other intangible assets %u2013 %u2013 %u2013 %u2013 %u2013 %u2013 %u2013 %u2013 %u2013Payments for financial assets %u2013 23 %u2013 %u2013 %u2013 %u2013 %u2013 %u2013 %u2013Total economic classification 104,220 108,492 123,729 144,840 141,354 141,354 153,975 139,541 144,779 8.92024/25Table 5 provides a summary of payments and budgeted estimates by economic classification, for the seven-year period, starting from 2021/22 to 2027/28 financial years. The total department%u2019s expenditure has increased from R104.220 million in 2021/22 to a revised estimate of R141.354 million in 2024/25, due to provision made for COLA. In 2025/26, the budget is expected to increase by 8.9 percent, whilst noting a decline in the outer years of the medium-term period (i.e. 2026/27 and 2027/28), due to the impact of once acquisitions as observed under goods and services and capital expenditure. Compensation of employee%u2019s expenditure increased from R76.349 million in 2021/22 to the revised estimate of R89.550 million in 2024/25, primarily due to provision for wage agreement. The department further saw a significant growth of 23 per cent in budget for 2025/26 due to additional funding specifically and exclusively provided for the creation of Safety Partnership Directorate, coupled with provision made for the carry through Cost-of-Living Adjustment. The outer years show a stabilised growing pattern and the growth caters for general inflationary changes. Goods and services increased from R22.779 million in 2021/22 to the revised estimate of R45.613 million in 2024/25 due to additional funding received during adjustment estimates, whilst provision in budget for 2025/26 and the outer years shows a declining scenario partly due to the impact of reduction of baseline implemented on goods and services as well as once-off acquisition of office tools. 867
