
Page 891 - Demo
P. 891
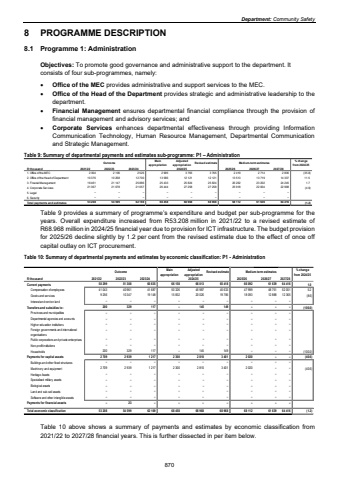
Department: Community Safety 8 PROGRAMME DESCRIPTION 8.1 Programme 1: Administration Objectives: To promote good governance and administrative support to the department. It consists of four sub-programmes, namely: %uf0b7 Office of the MEC provides administrative and support services to the MEC. %uf0b7 Office of the Head of the Department provides strategic and administrative leadership to the department. %uf0b7 Financial Management ensures departmental financial compliance through the provision of financial management and advisory services; and %uf0b7 Corporate Services enhances departmental effectiveness through providing Information Communication Technology, Human Resource Management, Departmental Communication and Strategic Management. Table 9: Summary of departmental payments and estimates sub-programme: P1 %u2013 AdministrationOutcome Main appropriationAdjusted appropriation Revised estimate Medium-term estimates % change from 2024/25R thousand 2021/22 2022/23 2023/24 2025/26 2026/27 2027/281. Office of the MEC 2 106 2 004 2 526 2 995 3 765 3 765 2 419 2 714 2 836 (35.8)2. Office of the Head of Department 10 376 10 268 12 700 13 586 12 121 12 121 13 513 13 719 14 337 11.53. Finacial Management 19 461 21 147 25 886 25 433 25 824 25 824 26 262 23 202 24 245 1.74. Corporate Services 21 367 21 078 21 057 26 444 27 258 27 258 25 918 22 004 22 998 (4.9)5. Legal %u2013 %u2013 %u2013 %u2013 %u2013 %u2013 %u2013 %u2013 %u20136. Security %u2013 %u2013 %u2013 %u2013 %u2013 %u2013 %u2013 %u2013 %u2013Total payments and estimates 53 208 54 599 62 169 68 458 68 968 68 968 68 112 61 639 64 416 (1.2)2024/25Table 9 provides a summary of programme%u2019s expenditure and budget per sub-programme for the years. Overall expenditure increased from R53.208 million in 2021/22 to a revised estimate of R68.968 million in 2024/25 financial year due to provision for ICT infrastructure. The budget provision for 2025/26 decline slightly by 1.2 per cent from the revised estimate due to the effect of once off capital outlay on ICT procurement. Table 10: Summary of departmental payments and estimates by economic classification: P1 - AdministrationOutcome Main appropriationAdjusted appropriation Revised estimate Medium-term estimates % change from 2024/25R thousand 2021/22 2022/23 2023/24 2025/26 2026/27 2027/28Current payments 51 308 50 299 60 835 66 158 66 013 65 418 66 092 61 639 64 416 1.0Compensation of employees 40 961 41 043 41 687 50 326 45 987 45 633 47 999 48 751 52 051 5.2Goods and services 10 347 9 256 19 148 15 832 20 026 19 785 18 093 12 888 12 365 (8.6)Interest and rent on land %u2013 %u2013 %u2013 %u2013 %u2013 %u2013 %u2013 %u2013 %u2013 Transfers and subsidies to: 329 200 117 %u2013 145 149 %u2013 %u2013 %u2013 (100.0)Provinces and municipalities %u2013 %u2013 %u2013 %u2013 %u2013 %u2013 %u2013 %u2013 %u2013 Departmental agencies and accounts %u2013 %u2013 %u2013 %u2013 %u2013 %u2013 %u2013 %u2013 %u2013 Higher education institutions %u2013 %u2013 %u2013 %u2013 %u2013 %u2013 %u2013 %u2013 %u2013Foreign governments and international organisations %u2013 %u2013 %u2013 %u2013 %u2013 %u2013 %u2013 %u2013 %u2013Public corporations and private enterprises %u2013 %u2013 %u2013 %u2013 %u2013 %u2013 %u2013 %u2013 %u2013Non-profit institutions %u2013 %u2013 %u2013 %u2013 %u2013 %u2013 %u2013 %u2013 %u2013Households 200 329 117 %u2013 145 149 %u2013 %u2013 %u2013 (100.0)Payments for capital assets 2 709 2 939 1 217 2 300 2 810 3 401 2 020 %u2013 %u2013 (40.6)Buildings and other fixed structures %u2013 %u2013 %u2013 %u2013 %u2013 %u2013 %u2013 %u2013 %u2013Machinery and equipment 2 709 2 939 1 217 2 300 2 810 3 401 2 020 %u2013 %u2013 (40.6)Heritage Assets %u2013 %u2013 %u2013 %u2013 %u2013 %u2013 %u2013 %u2013 %u2013Specialised military assets %u2013 %u2013 %u2013 %u2013 %u2013 %u2013 %u2013 %u2013 %u2013Biological assets %u2013 %u2013 %u2013 %u2013 %u2013 %u2013 %u2013 %u2013 %u2013Land and sub-soil assets %u2013 %u2013 %u2013 %u2013 %u2013 %u2013 %u2013 %u2013 %u2013Software and other intangible assets %u2013 %u2013 %u2013 %u2013 %u2013 %u2013 %u2013 %u2013 %u2013Payments for financial assets %u2013 23 %u2013 %u2013 %u2013 %u2013 %u2013 %u2013 %u2013Total economic classification 53 208 54 599 62 169 68 458 68 968 68 968 68 112 64 416 61 639 (1.2)2024/25Table 10 above shows a summary of payments and estimates by economic classification from 2021/22 to 2027/28 financial years. This is further dissected in per item below. 870
