
Page 889 - Demo
P. 889
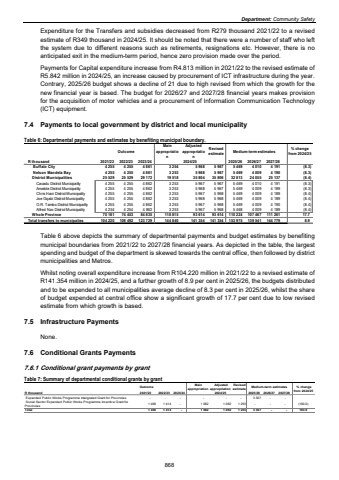
Department: Community Safety Expenditure for the Transfers and subsidies decreased from R279 thousand 2021/22 to a revised estimate of R349 thousand in 2024/25. It should be noted that there were a number of staff who left the system due to different reasons such as retirements, resignations etc. However, there is no anticipated exit in the medium-term period, hence zero provision made over the period. Payments for Capital expenditure increase from R4.813 million in 2021/22 to the revised estimate of R5.842 million in 2024/25, an increase caused by procurement of ICT infrastructure during the year. Contrary, 2025/26 budget shows a decline of 21 due to high revised from which the growth for the new financial year is based. The budget for 2026/27 and 2027/28 financial years makes provision for the acquisition of motor vehicles and a procurement of Information Communication Technology (ICT) equipment. 7.4 Payments to local government by district and local municipality Table 6: Departmental payments and estimates by benefiting municipal boundary.OutcomeMain appropriationAdjusted appropriationRevised estimate Medium-term estimates % change from 2024/25R thousand 2021/22 2022/23 2023/24 2025/26 2026/27 2027/28 Buffalo City 4 255 4 255 4 861 3 254 5 968 5 967 5 469 4 010 4 191 (8.3) Nelson Mandela Bay 4 255 4 861 4 255 3 253 5 968 5 967 5 469 4 009 4 190 (8.3)District Municipalities 25 529 29 172 25 529 19 518 35 804 35 806 32 813 24 055 25 137 (8.4)Cacadu District Municipality 4 255 4 862 4 255 3 253 5 967 5 967 5 469 4 010 4 191 (8.3)Amatole District Municipality 4 255 4 862 4 255 3 253 5 968 5 967 5 469 4 009 4 189 (8.3)Chris Hani District Municipality 4 255 4 255 4 862 3 253 5 967 5 968 5 469 4 009 4 189 (8.4)Joe Gqabi District Municipality 4 255 4 255 4 862 3 253 5 968 5 968 5 469 4 009 4 189 (8.4)O.R. Tambo District Municipality 4 255 4 255 4 862 3 253 5 967 5 968 5 469 4 009 4 190 (8.4)Alfred Nzo District Municipality 4 254 4 254 4 862 3 253 5 967 5 968 5 468 4 009 4 189 (8.4)Whole Province 74 453 84 835 70 181 118 815 93 614 93 614 110 224 107 467 111 261 17.7Total transfers to municipalies 104 220 108 492 123 729 144 840 141 354 141 354 153 975 139 541 144 779 8.92024/25Table 6 above depicts the summary of departmental payments and budget estimates by benefiting municipal boundaries from 2021/22 to 2027/28 financial years. As depicted in the table, the largest spending and budget of the department is skewed towards the central office, then followed by district municipalities and Metros. Whilst noting overall expenditure increase from R104.220 million in 2021/22 to a revised estimate of R141.354 million in 2024/25, and a further growth of 8.9 per cent in 2025/26, the budgets distributed and to be expended to all municipalities average decline of 8.3 per cent in 2025/26, whilst the share of budget expended at central office show a significant growth of 17.7 per cent due to low revised estimate from which growth is based. 7.5 Infrastructure Payments None. 7.6 Conditional Grants Payments 7.6.1 Conditional grant payments by grant Table 7: Summary of departmental conditional grants by grant Outcome Mainappropriation Adjusted appropriation Revised estimate 2021/22 2022/23 2023/24 2024/25 2025/26 2026/27 2027/28 - - - - - 3 307 - - - 1 458 1 414 - 1 062 1 062 1 253 - - - (100.0)Total 1 458 1 414 - 1 062 1 062 1 253 3 307 - - 163.9 R thousand % change from 2024/25 Expanded Public Works Programme Intergrated Grant for Provincies Social Sector Expanded Public Works Programme Incentive Grant for Provincies Medium-term estimates868
