
Page 535 - Provincial Treasury Estimates.pdf
P. 535
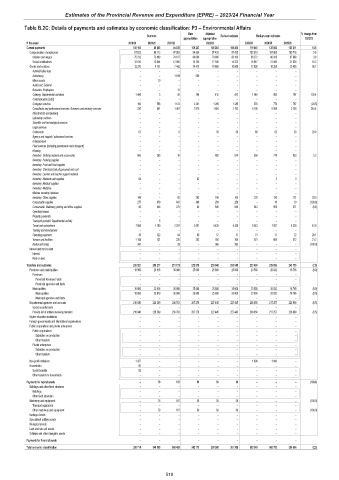
Estimates of the Provincial Revenue and Expenditure (EPRE) – 2023/24 Financial Year
Table B.2C: Details of payments and estimates by economic classification: P3 – Environmental Affairs
Main Adjusted % change from
Outcome Revised estimate Medium-term estimates
appropriation appropriation 2022/23
R thousand 2019/20 2020/21 2021/22 2022/23 2023/24 2024/25 2025/26
Current payments 100 193 89 863 94 535 109 247 108 293 108 293 119 945 125 864 123 211 10.8
Compensation of employees 87 823 85 112 87 093 94 834 97 425 97 425 102 919 107 605 109 716 5.6
Salaries and wages 75 213 72 468 74 107 80 089 79 885 83 103 86 272 86 205 87 888 3.8
Social contributions 12 610 12 644 12 986 14 745 17 540 14 322 16 647 21 400 21 828 16.2
Goods and services 12 370 4 751 7 442 14 413 10 868 10 868 17 026 18 259 13 495 56.7
Administrative fees – – – – – – – – –
Advertising – – 1 169 509 – – – – –
Minor assets – 10 – – – – – – –
Audit cost: External – – – – – – – – –
Bursaries: Employees – – 12 – – – – – –
Catering: Departmental activities 1 406 5 50 104 412 412 1 040 985 797 152.4
Communication (G&S) – – – – – – – – –
Computer services 100 558 1 122 2 241 1 285 1 285 970 779 787 (24.5)
Consultants and professional services: Business and advisory services 230 841 1 487 7 675 1 924 1 792 6 100 6 959 5 728 240.4
Infrastructure and planning – – – – – – – – –
Laboratory services – – – – – – – – –
Scientific and technological services – – – – – – – – –
Legal services – – – – – – – – –
Contractors 67 7 6 – 50 50 60 62 63 20.0
Agency and support / outsourced services – – – – – – – – –
Entertainment – – – – – – – – –
Fleet services (including government motor transport) – – – – – – – – –
Housing – – – – – – – – –
Inventory: Clothing material and accessories 605 265 10 – 682 814 856 774 633 5.2
Inventory: Farming supplies – – – – – – – – –
Inventory: Food and food supplies – – – – – – – – –
Inventory: Chemicals,fuel,oil,gas,wood and coal – – – – – – – – –
Inventory: Learner and teacher support material – – – – – – – – –
Inventory: Materials and supplies 64 – – 62 – – – 3 3
Inventory: Medical supplies – – – – – – – – –
Inventory: Medicine – – – – – – – – –
Medsas inventory interface – – – – – – – – –
Inventory: Other supplies 148 – 82 292 100 100 120 130 131 20.0
Consumable supplies 277 679 641 460 250 250 – 10 10 (100.0)
Consumable: Stationery,printing and office supplies 93 348 273 80 545 545 543 565 371 (0.4)
Operating leases – – – – – – – – –
Property payments – – – – – – – – –
Transport provided: Departmental activity – 5 – – – – – – –
Travel and subsistence 7 958 1 780 2 287 2 667 4 438 4 438 6 343 7 057 4 328 42.9
Training and development – – – – – – – – –
Operating payments 36 122 54 60 57 57 73 71 72 28.1
Venues and facilities 1 145 131 220 263 760 760 921 864 572 21.2
Rental and hiring 241 – 29 – 365 365 – – – (100.0)
Interest and rent on land – – – – – – – – –
Interest – – – – – – – – –
Rent on land – – – – – – – – –
Transfers and subsidies 236 521 250 217 273 731 232 878 253 045 253 045 233 400 239 889 243 755 (7.8)
Provinces and municipalities 18 956 23 918 36 968 25 600 25 600 25 600 23 550 20 832 16 765 (8.0)
Provinces – – – – – – – – –
Provincial Revenue Funds – – – – – – – – –
Provincial agencies and funds – – – – – – – – –
Municipalities 18 956 23 918 36 968 25 600 25 600 25 600 23 550 20 832 16 765 (8.0)
Municipalities 18 956 23 918 36 968 25 600 25 600 25 600 23 550 20 832 16 765 (8.0)
Municipal agencies and funds – – – – – – – – –
Departmental agencies and accounts 216 046 226 299 236 763 207 278 227 445 227 445 208 050 217 257 226 990 (8.5)
Social security funds – – – – – – – – –
Provide list of entities receiving transfers 216 046 226 299 236 763 207 278 227 445 227 445 208 050 217 257 226 990 (8.5)
Higher education institutions – – – – – – – – –
Foreign governments and international organisations – – – – – – – – –
Public corporations and private enterprises – – – – – – – – –
Public corporations – – – – – – – – –
Subsidies on production – – – – – – – – –
Other transfers – – – – – – – – –
Private enterprises – – – – – – – – –
Subsidies on production – – – – – – – – –
Other transfers – – – – – – – – –
Non-profit institutions 1 427 – – – – – 1 800 1 800 –
Households 92 – – – – – – – –
Social benefits 92 – – – – – – – –
Other transfers to households – – – – – – – – –
Payments for capital assets – 78 167 50 50 50 – – – (100.0)
Buildings and other fixed structures – – – – – – – – –
Buildings – – – – – – – – –
Other fixed structures – – – – – – – – –
Machinery and equipment – 78 167 50 50 50 – – – (100.0)
Transport equipment – – – – – – – – –
Other machinery and equipment – 78 167 50 50 50 – – – (100.0)
Heritage Assets – – – – – – – – –
Specialised military assets – – – – – – – – –
Biological assets – – – – – – – – –
Land and sub-soil assets – – – – – – – – –
Software and other intangible assets – – – – – – – – –
Payments for financial assets – – – – – – – – –
Total economic classification 336 714 340 158 368 433 342 175 361 388 361 388 353 345 365 753 366 966 (2.2)
518