
Page 533 - Provincial Treasury Estimates.pdf
P. 533
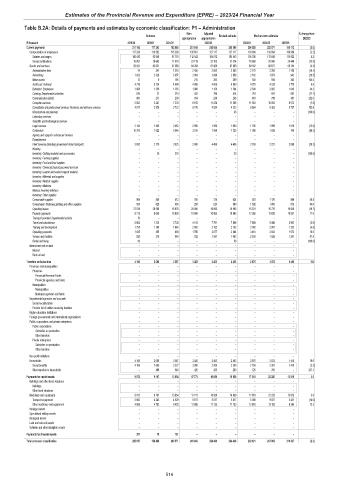
Estimates of the Provincial Revenue and Expenditure (EPRE) – 2023/24 Financial Year
Table B.2A: Details of payments and estimates by economic classification: P1 – Administration
Main Adjusted % change from
Outcome Revised estimate Medium-term estimates
appropriation appropriation 2022/23
R thousand 2019/20 2020/21 2021/22 2022/23 2023/24 2024/25 2025/26
Current payments 211 169 177 203 182 869 219 845 215 086 215 086 208 528 222 571 195 112 (3.0)
Compensation of employees 117 238 113 582 115 289 135 551 127 117 127 117 124 366 133 694 136 368 (2.2)
Salaries and wages 100 436 93 940 97 710 112 432 104 012 105 543 105 706 113 649 115 922 0.2
Social contributions 16 802 19 642 17 579 23 119 23 105 21 574 18 660 20 045 20 446 (13.5)
Goods and services 93 931 63 621 67 580 84 294 87 969 87 969 84 162 88 877 58 744 (4.3)
Administrative fees 14 341 1 216 2 455 2 683 2 683 2 170 2 208 1 180 (19.1)
Advertising 1 823 2 328 2 357 2 063 2 888 2 858 2 102 1 873 942 (26.5)
9
Minor assets 12 195 215 285 269 550 556 362 104.5
Audit cost: External 4 776 3 724 4 094 4 000 4 000 4 000 4 270 4 228 2 770 6.8
Bursaries: Employees 1 988 1 356 1 385 1 900 1 150 1 594 2 300 2 025 1 045 44.3
Catering: Departmental activities 514 27 219 432 795 814 719 691 697 (11.7)
Communication (G&S) 887 211 239 764 246 246 819 799 407 232.9
Computer services 5 052 5 347 7 374 6 613 11 474 11 568 11 353 18 053 9 573 (1.9)
Consultants and professional services: Business and advisory services 4 017 2 879 3 722 8 176 4 524 4 222 8 564 8 363 5 737 102.8
–
–
Infrastructure and planning – 48 – (100.0)
–
–
–
–
–
Laboratory services – –
–
–
–
–
–
–
–
–
–
–
–
–
Scientific and technological services – –
–
Legal services 2 134 1 405 2 452 2 900 1 950 1 950 1 705 1 999 1 019 (12.6)
Contractors 10 703 1 922 5 046 3 156 7 568 7 325 1 000 1 038 748 (86.3)
–
–
–
–
–
–
Agency and support / outsourced services – –
–
–
–
–
Entertainment – –
–
–
–
–
Fleet services (including government motor transport) 3 883 2 179 3 025 3 000 4 456 4 456 3 150 3 237 2 069 (29.3)
–
–
Housing – –
–
–
–
–
–
–
Inventory: Clothing material and accessories – 30 218 20 – (100.0)
–
–
–
–
–
–
–
–
–
–
Inventory: Farming supplies – –
–
–
–
–
Inventory: Food and food supplies – –
–
–
–
–
–
–
–
–
–
Inventory: Chemicals,fuel,oil,gas,wood and coal – –
–
–
–
–
–
–
Inventory: Learner and teacher support material – –
–
–
–
–
Inventory: Materials and supplies – –
–
–
–
–
–
–
–
–
Inventory: Medical supplies – –
–
–
–
–
–
–
–
–
Inventory: Medicine – –
–
–
–
–
–
–
–
Medsas inventory interface – –
–
–
–
–
–
–
Inventory: Other supplies – –
–
–
–
–
Consumable supplies 969 559 413 700 730 634 931 1 176 988 46.8
Consumable: Stationery,printing and office supplies 554 829 995 258 623 669 1 302 1 005 815 94.6
Operating leases 37 576 28 568 16 878 28 000 19 095 19 095 15 331 15 770 10 928 (19.7)
Property payments 8 713 8 659 10 838 10 940 10 965 10 965 12 265 12 829 10 957 11.9
–
–
–
–
–
–
–
Transport provided: Departmental activity 70 –
Travel and subsistence 6 603 1 224 3 720 4 143 7 791 7 908 7 669 5 488 3 942 (3.0)
Training and development 1 758 1 190 1 646 2 002 2 102 2 102 2 002 2 081 1 352 (4.8)
Operating payments 1 035 455 699 1 795 3 077 3 084 3 410 3 932 1 972 10.6
Venues and facilities 820 379 849 782 1 567 1 403 2 550 1 526 1 241 81.8
–
–
–
Rental and hiring 30 56 – (100.0)
–
–
–
–
Interest and rent on land – –
–
–
–
–
–
–
–
–
–
–
–
–
Interest – –
–
Rent on land – –
–
–
–
–
–
–
–
Transfers and subsidies 4 169 2 088 3 567 3 425 2 403 2 403 2 875 3 072 1 410 19.6
Provinces and municipalities – –
–
–
–
–
–
–
–
–
–
–
–
–
–
Provinces – –
–
–
Provincial Revenue Funds – –
–
–
–
–
–
–
–
–
–
–
Provincial agencies and funds – –
–
–
–
–
–
–
–
–
Municipalities – –
–
–
–
–
–
–
–
Municipalities – –
–
–
–
–
–
–
–
–
–
Municipal agencies and funds – –
–
–
–
–
–
–
–
Departmental agencies and accounts – –
–
–
–
–
–
Social security funds – –
–
–
–
–
Provide list of entities receiving transfers – –
–
–
–
–
–
–
–
–
–
Higher education institutions – –
–
–
–
–
–
Foreign governments and international organisations – –
–
–
–
–
–
–
–
–
–
Public corporations and private enterprises – –
–
–
–
–
–
Public corporations – –
–
–
–
–
–
–
–
–
–
–
Subsidies on production – –
–
–
Other transfers – –
–
–
–
–
–
–
–
–
–
Private enterprises – –
–
–
–
–
–
–
–
–
Subsidies on production – –
–
–
–
–
–
Other transfers – –
–
–
–
–
–
–
–
–
–
–
–
–
–
Non-profit institutions – –
Households 4 169 2 088 3 567 3 425 2 403 2 403 2 875 3 072 1 410 19.6
Social benefits 4 169 1 600 3 227 3 000 2 200 2 200 2 150 2 307 1 410 (2.3)
Other transfers to households – 488 340 425 203 203 725 765 – 257.1
Payments for capital assets 9 972 9 107 13 954 17 773 16 950 16 950 17 618 22 220 13 815 3.9
–
–
–
Buildings and other fixed structures – –
–
–
–
–
–
–
–
Buildings – –
–
–
–
–
–
Other fixed structures – –
–
–
–
–
–
–
Machinery and equipment 9 972 9 107 13 954 17 773 16 950 16 950 17 618 22 220 13 815 3.9
Transport equipment 5 963 4 345 4 529 5 817 5 817 5 817 5 000 9 027 5 431 (14.0)
Other machinery and equipment 4 009 4 762 9 425 11 956 11 133 11 133 12 618 13 193 8 384 13.3
Heritage Assets – –
–
–
–
–
–
–
–
–
Specialised military assets – –
–
–
–
–
–
–
–
–
–
–
–
–
–
Biological assets – –
–
–
–
–
–
–
–
Land and sub-soil assets – –
–
–
Software and other intangible assets – –
–
–
–
–
–
–
–
–
–
–
Payments for financial assets 307 70 181 –
Total economic classification 225 617 188 468 200 571 241 043 234 439 234 439 229 021 247 863 210 337 (2.3)
516