Page 532 - Provincial Treasury Estimates.pdf
P. 532

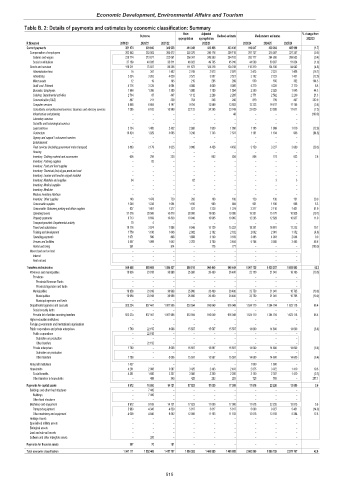
Economic Development, Environmental Affairs and Tourism
           Table B. 2: Details of payments and estimates by economic classification: Summary
                                                                   Main   Adjusted                           % change from
                                                    Outcome                    Revised estimate  Medium-term estimates
                                                                 appropriation  appropriation                 2022/23
            R thousand                       2019/20  2020/21  2021/22    2022/23       2023/24  2024/25  2025/26
            Current payments                               381 174                 329 840                 346 928                 414 043                 423 436                 423 436                 416 047                 439 283                 405 999  (1.7)
             Compensation of employees                     262 963                 253 903                 260 572                 302 370                 299 118                 299 118                 297 737                 315 097                 321 357  (0.5)
              Salaries and wages                           225 774                 213 877                 222 061                 256 347                 249 353                 254 102                 253 177                 264 260                 269 503  (0.4)
              Social contributions                           37 189                   40 026                   38 511                   46 023                   49 765                   45 016                   44 560                   50 837                   51 854  (1.0)
             Goods and services                            118 211                   75 937                   86 356                 111 673                 124 318                 124 318                 118 310                 124 186                   84 642  (4.8)
              Administrative fees                14    341                     1 482                     2 745                     2 973                     2 970                     2 475                     2 531                     1 406  (16.7)
              Advertising                                      2 524                     3 263                     4 029                     3 572                     3 557                     3 527                     3 102                     2 723                     1 451  (12.0)
              Minor assets                       12     19     195    215    285    269    550     556    362   104.5
              Audit cost: External                             4 776                     3 724                     4 094                     4 000                     4 000                     4 000                     4 270                     4 228                     2 770  6.8
              Bursaries: Employees                             1 988                     1 356                     1 399                     1 900                     1 150                     1 594                     2 300                     2 025                     1 045  44.3
              Catering: Departmental activities                      2 734  87  447                     1 112                     2 268                     2 285                     2 771                     2 562                     2 239  21.3
              Communication (G&S)               887    211     239    764    246    246    819     799    407   232.9
              Computer services                                5 868                     6 664                     9 197                     9 754                   13 589                   13 683                   13 223                   19 817                   11 155  (3.4)
              Consultants and professional services: Business and advisory services                      7 385                     6 183                   10 969                   22 132                   24 265                   23 749                   22 020                   23 388                   17 611  (7.3)
              Infrastructure and planning        –      –      –       –      –      48     –      –       –    (100.0)
              Laboratory services                –      –      –       –      –      –      –      –       –
              Scientific and technological services  –  –      –       –      –      –      –      –       –
              Legal services                                   2 134                     1 405                     2 452                     2 900                     1 950                     1 950                     1 705                     1 999                     1 019  (12.6)
              Contractors                                    10 824                     1 929                     5 065                     3 246                     7 743                     7 531                     1 161                     1 194  906  (84.6)
              Agency and support / outsourced services  –  –   –       –      –      –      –      –       –
              Entertainment                      –      –      –       –      –      –      –      –       –
              Fleet services (including government motor transport)                      3 883                     2 179                     3 025                     3 000                     4 456                     4 456                     3 150                     3 237                     2 069  (29.3)
              Housing                            –      –      –       –      –      –      –      –         –
              Inventory: Clothing material and accessories  605  295  228  –  682   834    856     774    633    2.6
              Inventory: Farming supplies        –      83     –       –      –      –      –      –       –
              Inventory: Food and food supplies  –      –      –       –      –      –      –      –       –
              Inventory: Chemicals,fuel,oil,gas,wood and coal  –  –  –  –     –      –      –      –         –
              Inventory: Learner and teacher support material  –  –  –  –     –      –      –      –       –
              Inventory: Materials and supplies  64                           –  –  62  –  –  –    3         3
              Inventory: Medical supplies        –      –      –       –      –      –      –      –       –
              Inventory: Medicine                –      –      –       –      –      –      –      –       –
              Medsas inventory interface         –      –      –       –      –      –      –      –       –
              Inventory: Other supplies         148                     1 478  720  292  100  100  120  130  131  20.0
              Consumable supplies                              1 246                     1 238                     1 054                     1 160  980  884  931                     1 186  998  5.3
              Consumable: Stationery,printing and office supplies  937                     1 401                     1 377  831  1 228                     1 274                     2 317                     2 110                     1 431  81.9
              Operating leases                               37 576                   28 568                   16 878                   28 000  19 095                   19 095                   15 331                   15 770                   10 928  (19.7)
              Property payments                                8 713                     8 659                   10 838                   10 940  10 965                   10 965                   12 265                   12 829                   10 957  11.9
              Transport provided: Departmental activity  70  5  –      –      –      –      –      –       –
              Travel and subsistence                         19 176                     3 974                     7 998                     8 946  15 129                   15 332                   18 351                   16 881                   11 232  19.7
              Training and development                         1 758                     1 190                     1 646                     2 002  2 102                     2 102                     2 002                     2 081                     1 352  (4.8)
              Operating payments                               1 071  586  868                     1 898  3 140                     3 169                     3 483                     4 003                     2 044  9.9
              Venues and facilities                            3 457                     1 099                     1 642                     2 202  3 700                     3 484                     5 108                     3 360                     2 493  46.6
              Rental and hiring                 361     –      514     –     715    771     –      –       –    (100.0)
             Interest and rent on land           –      –      –       –      –      –      –      –         –
              Interest                           –      –      –       –      –      –      –      –         –
              Rent on land                       –      –      –       –      –      –      –      –         –
            Transfers and subsidies                        949 658                 985 608              1 056 527                 898 516                 960 449                 960 449              1 567 135              1 435 217              1 655 893  63.2
             Provinces and municipalities                     18 956                   23 918                   36 968                   25 900                   26 400                   26 400                   23 750                   21 041                   16 765  (10.0)
              Provinces                          –      –      –       –      –      –      –      –         –
               Provincial Revenue Funds          –      –      –       –      –      –      –      –         –
               Provincial agencies and funds     –      –      –       –      –      –      –      –         –
              Municipalities                                 18 956                   23 918                   36 968                   25 900                   26 400                   26 400                   23 750                   21 041                   16 765  (10.0)
               Municipalities                                18 956                   23 918                   36 968                   25 900                   26 400                   26 400                   23 750                   21 041                   16 765  (10.0)
               Municipal agencies and funds      –      –      –       –      –      –      –      –         –
             Departmental agencies and accounts                  923 234                 937 447              1 007 986                 853 594                 916 049                 916 049              1 524 110              1 394 704              1 623 118  66.4
              Social security funds              –      –      –       –      –      –      –      –         –
              Provide list of entities receiving transfers                  923 234                 937 447              1 007 986                 853 594                 916 049                 916 049              1 524 110              1 394 704              1 623 118  66.4
             Higher education institutions       –      –      –       –      –      –      –      –         –
             Foreign governments and international organisations  –  –  –  –  –      –      –      –       –
             Public corporations and private enterprises                      1 780                   22 155                     8 006                   15 597                   15 597                   15 597                   14 600                   14 600                   14 600  (6.4)
              Public corporations                –    22 155   –       –      –      –      –      –         –
               Subsidies on production           –      –      –       –      –      –      –      –         –
               Other transfers                   –    22 155   –       –      –      –      –      –       –
              Private enterprises                              1 780  –  8 006                   15 597                   15 597                   15 597                   14 600                   14 600                   14 600  (6.4)
               Subsidies on production           –      –      –       –      –      –      –      –       –
               Other transfers                                 1 780  –  8 006                   15 597                   15 597                   15 597                   14 600                   14 600                   14 600  (6.4)
             Non-profit institutions                           1 427  –  –  –  –     –                     1 800                     1 800  –
             Households                                        4 261                     2 088                     3 567                     3 425                     2 403                     2 403                     2 875                     3 072                     1 410  19.6
              Social benefits                                  4 261                     1 600                     3 227                     3 000                     2 200                     2 200                     2 150                     2 307                     1 410  (2.3)
              Other transfers to households      –     488     340    425    203    203    725     765     –    257.1
            Payments for capital assets                        9 972                   16 950                   14 121                   17 823                   17 000                   17 000                   17 618                   22 220                   13 815  3.6
             Buildings and other fixed structures  –   7 445   –       –      –      –      –      –         –
              Buildings                          –     7 445   –       –      –      –      –      –         –
              Other fixed structures             –      –      –       –      –      –      –      –       –
             Machinery and equipment                           9 972                     9 185                   14 121                   17 823                   17 000                   17 000                   17 618                   22 220                   13 815  3.6
              Transport equipment                              5 963                     4 345                     4 529                     5 817                     5 817                     5 817                     5 000                     9 027                     5 431  (14.0)
              Other machinery and equipment                      4 009                     4 840                     9 592                   12 006                   11 183                   11 183                   12 618                   13 193                     8 384  12.8
             Heritage Assets                     –      –      –       –      –      –      –      –       –
             Specialised military assets         –      –      –       –      –      –      –      –       –
             Biological assets                   –      –      –       –      –      –      –      –         –
             Land and sub-soil assets            –      –      –       –      –      –      –      –       –
             Software and other intangible assets  –   320     –       –      –      –      –      –       –
            Payments for financial assets       307     70     181     –      –      –      –      –         –
            Total economic classification               1 341 111              1 332 468              1 417 757              1 330 382              1 400 885              1 400 885              2 000 800              1 896 720              2 075 707  42.8


                                                             515
   527   528   529   530   531   532   533   534   535   536   537