
Page 654 - Provincial Treasury Estimates.pdf
P. 654
Provincial Treasury
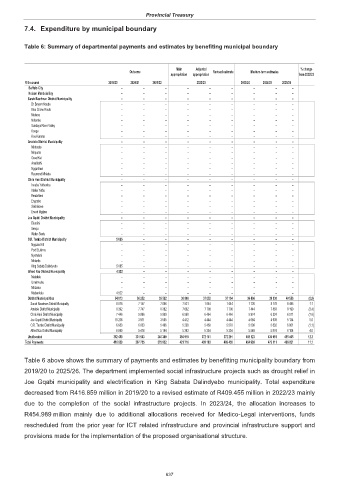
7.4. Expenditure by municipal boundary
Table 6: Summary of departmental payments and estimates by benefiting municipal boundary
Main Adjusted % change
Outcome Revised estimate Medium-term estimates
appropriation appropriation from 2022/23
R thousand 2019/20 2020/21 2021/22 2022/23 2023/24 2024/25 2025/26
Buffalo City – – – – – – – – –
Nelson Mandela Bay – – – – – – – – –
Sarah Baartman District Municipality – – – – – – – – –
Dr Beyers Naude – – – – – – – – –
Blue Crane Route – – – – – – – – –
Makana – – – – – – – – –
Ndlambe – – – – – – – – –
Sundays River Valley – – – – – – – – –
Kouga – – – – – – – – –
Kou-Kamma – – – – – – – – –
Amatole District Municipality – – – – – – – – –
Mbhashe – – – – – – – – –
Mnquma – – – – – – – – –
Great Kei – – – – – – – – –
Amahlathi – – – – – – – – –
Ngqushwa – – – – – – – – –
Raymond Mhlaba – – – – – – – – –
Chris Hani District Municipality – – – – – – – – –
Inxuba Yethemba – – – – – – – – –
Intsika Yethu – – – – – – – – –
Emalahleni – – – – – – – – –
Engcobo – – – – – – – – –
Sakhisizwe – – – – – – – – –
Enoch Mgijima – – – – – – – – –
Joe Gqabi District Municipality – – – – – – – – –
Elundini – – – – – – – – –
Senqu – – – – – – – – –
Walter Sisulu – – – – – – – – –
O.R. Tambo District Municipality 5 065 – – – – – – – –
Ngquza Hill – – – – – – – – –
Port St Johns – – – – – – – – –
Nyandeni – – – – – – – – –
Mhlontlo – – – – – – – – –
King Sabata Dalindyebo 5 065 – – – – – – – –
Alfred Nzo District Municipality 4 522 – – – – – – – –
Matatiele – – – – – – – – –
Umzimvubu – – – – – – – – –
Mbizana – – – – – – – – –
Ntabankulu 4 522 – – – – – – – –
District Municipalities 54 813 36 252 35 592 36 806 37 052 37 164 36 866 39 030 40 556 (0.8)
Sarah Baartman District Municipality 8 016 7 147 7 066 7 521 7 644 7 644 7 726 8 178 8 496 1.1
Amatole District Municipality 8 392 7 747 8 382 7 682 7 708 7 708 7 444 7 883 8 190 (3.4)
Chris Hani District Municipality 7 446 5 996 5 959 6 560 6 464 6 464 5 974 6 324 6 571 (7.6)
Joe Gqabi District Municipality 18 236 3 911 3 505 4 412 4 444 4 444 4 664 4 939 5 134 5.0
O.R. Tambo District Municipality 6 683 6 033 5 486 5 238 5 458 5 570 5 509 5 832 6 061 (1.1)
Alfred Nzo District Municipality 6 040 5 418 5 194 5 393 5 334 5 334 5 549 5 874 6 104 4.0
Unallocated 352 459 331 503 340 340 384 910 372 141 372 291 418 123 434 081 455 465 12.3
Total Payments 416 859 367 755 375 932 421 716 409 193 409 455 454 989 473 111 496 021 11.1
Table 6 above shows the summary of payments and estimates by benefitting municipality boundary from
2019/20 to 2025/26. The department implemented social infrastructure projects such as drought relief in
Joe Gqabi municipality and electrification in King Sabata Dalindyebo municipality. Total expenditure
decreased from R416.859 million in 2019/20 to a revised estimate of R409.455 million in 2022/23 mainly
due to the completion of the social infrastructure projects. In 2023/24, the allocation increases to
R454.989 million mainly due to additional allocations received for Medico-Legal interventions, funds
rescheduled from the prior year for ICT related infrastructure and provincial infrastructure support and
provisions made for the implementation of the proposed organisational structure.
637