
Page 659 - Provincial Treasury Estimates.pdf
P. 659
Estimates of the Provincial Revenue and Expenditure (EPRE) – 2023/24 Financial Year
Table 13: Summary of departmental payments and estimates sub-programme: P2- Sustainable Resource
Management
Main Adjusted
Outcome Revised estimate Medium-term estimates % change
appropriation appropriation from 2022/23
R thousand 2019/20 2020/21 2021/22 2022/23 2023/24 2024/25 2025/26
1. Programme Support 2 740 3 450 4 597 3 309 3 273 3 273 3 402 3 603 3 749 3.9
2. Economic Analysis 3 476 3 407 3 559 3 736 3 243 3 243 3 755 3 979 4 140 15.8
3. Fiscal Policy 8 507 8 563 8 934 9 187 8 907 8 907 9 304 9 856 10 242 4.5
4. Budget Management 55 750 55 065 56 370 65 278 62 329 62 329 68 181 69 367 67 126 9.4
Total payments and estimates 70 473 70 485 73 460 81 510 77 752 77 752 84 642 86 805 85 257 8.9
Table 14 Summary of departmental payments and estimates by economic classification: P2 – Sustainable
Resource Management
Main Adjusted
Outcome Revised estimate Medium-term estimates % change
appropriation appropriation
R thousand 2019/20 2020/21 2021/22 2022/23 2023/24 2024/25 2025/26 from 2022/23
Current payments 70 473 70 045 73 356 81 326 77 427 77 427 84 450 86 604 85 046 9.1
Compensation of employees 68 050 68 690 70 857 71 515 70 653 70 653 71 617 75 817 78 744 1.4
Goods and services 2 423 1 355 2 499 9 811 6 774 6 774 12 833 10 787 6 302 89.4
Interest and rent on land – – – – – – – – –
Transfers and subsidies to: – 440 104 184 325 325 192 201 211 (40.9)
Provinces and municipalities – – – – – – – – –
Departmental agencies and accounts – – – – – – – – –
Higher education institutions – – – – – – – – –
Foreign governments and international organisations – – – – – – – – –
Public corporations and private enterprises – – – – – – – – –
Non-profit institutions – – – – – – – – –
Households – 440 104 184 325 325 192 201 211 (40.9)
Payments for capital assets – – – – – – – – –
Buildings and other fixed structures – – – – – – – – –
Machinery and equipment – – – – – – – – –
Heritage Assets – – – – – – – – –
Specialised military assets – – – – – – – – –
Biological assets – – – – – – – – –
Land and sub-soil assets – – – – – – – – –
Software and other intangible assets – – – – – – – – –
Payments for financial assets – – – – – – – – –
Total economic classification 70 473 70 485 73 460 81 510 77 752 77 752 84 642 86 805 85 257 8.9
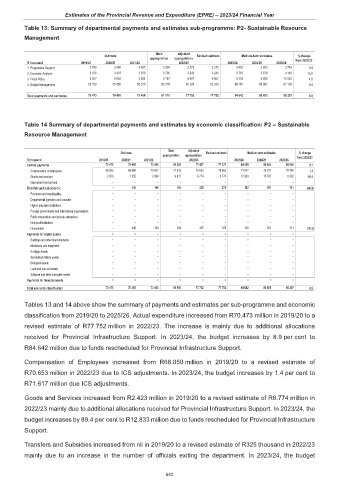
Tables 13 and 14 above show the summary of payments and estimates per sub-programme and economic
classification from 2019/20 to 2025/26. Actual expenditure increased from R70.473 million in 2019/20 to a
revised estimate of R77.752 million in 2022/23. The increase is mainly due to additional allocations
received for Provincial Infrastructure Support. In 2023/24, the budget increases by 8.9 per cent to
R84.642 million due to funds rescheduled for Provincial Infrastructure Support.
Compensation of Employees increased from R68.050 million in 2019/20 to a revised estimate of
R70.653 million in 2022/23 due to ICS adjustments. In 2023/24, the budget increases by 1.4 per cent to
R71.617 million due ICS adjustments.
Goods and Services increased from R2.423 million in 2019/20 to a revised estimate of R6.774 million in
2022/23 mainly due to additional allocations received for Provincial Infrastructure Support. In 2023/24, the
budget increases by 89.4 per cent to R12.833 million due to funds rescheduled for Provincial Infrastructure
Support.
Transfers and Subsidies increased from nil in 2019/20 to a revised estimate of R325 thousand in 2022/23
mainly due to an increase in the number of officials exiting the department. In 2023/24, the budget
642