
Page 673 - Provincial Treasury Estimates.pdf
P. 673
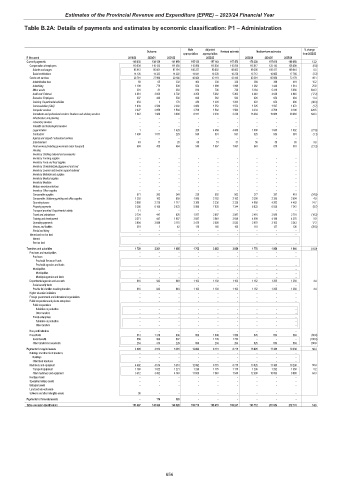
Estimates of the Provincial Revenue and Expenditure (EPRE) – 2023/24 Financial Year
Table B.2A: Details of payments and estimates by economic classification: P1 – Administration
Main Adjusted % change
Outcome Revised estimate Medium-term estimates
appropriation appropriation from 2022/23
R thousand 2019/20 2020/21 2021/22 2022/23 2023/24 2024/25 2025/26
Current payments 146 830 138 129 141 659 155 122 157 148 157 473 178 308 187 810 199 988 13.2
Compensation of employees 110 039 110 133 111 493 115 068 115 030 115 030 115 017 122 142 126 809 (0.0)
Salaries and wages 95 913 95 801 97 191 100 227 98 802 98 802 99 305 105 477 109 044 0.5
Social contributions 14 126 14 332 14 302 14 841 16 228 16 228 15 712 16 665 17 765 (3.2)
Goods and services 36 791 27 996 30 166 40 054 42 118 42 443 63 291 65 668 73 179 49.1
Administrative fees 58 65 333 464 330 330 380 399 418 15.2
Advertising 1 109 779 639 554 1 099 1 099 1 382 1 446 1 514 25.8
Minor assets 301 81 263 814 736 736 5 184 5 419 5 666 604.3
Audit cost: External 4 861 3 820 4 702 4 256 5 362 5 362 4 440 4 638 4 846 (17.2)
Bursaries: Employees 397 446 530 600 562 562 626 654 684 11.4
Catering: Departmental activities 854 3 170 280 1 203 1 203 622 654 686 (48.3)
Communication (G&S) 1 639 2 569 2 282 2 684 1 552 1 552 1 525 1 597 1 672 (1.7)
Computer services 2 027 2 656 1 584 2 726 1 582 1 583 8 334 8 706 9 100 426.5
Consultants and professional services: Business and advisory services 1 942 1 986 3 000 6 571 2 235 2 230 15 484 15 665 20 863 594.3
Infrastructure and planning – – – – – – – – –
Laboratory services – – – – – – – – –
Scientific and technological services – – – – – – – – –
Legal services 1 – 1 429 250 4 469 4 469 1 000 1 045 1 092 (77.6)
Contractors 1 400 1 071 229 530 531 531 525 553 581 (1.1)
Agency and support / outsourced services – – – – – – – – –
Entertainment 49 11 20 60 51 51 56 56 65 9.8
Fleet services (including government motor transport) 684 435 464 540 1 067 1 067 840 878 918 (21.3)
Housing – – – – – – – – –
Inventory: Clothing material and accessories – – – – – – – – –
Inventory: Farming supplies – – – – – – – – –
Inventory: Food and food supplies – – – – – – – – –
Inventory: Chemicals,fuel,oil,gas,wood and coal – – – – – – – – –
Inventory: Learner and teacher support material – – – – – – – – –
Inventory: Materials and supplies – – – – – – – – –
Inventory: Medical supplies – – – – – – – – –
Inventory: Medicine – – – – – – – – –
Medsas inventory interface – – – – – – – – –
Inventory: Other supplies – – – – – – – – –
Consumable supplies 871 263 246 230 502 502 377 397 419 (24.9)
Consumable: Stationery,printing and office supplies 1 293 162 695 1 995 2 182 2 182 2 290 2 395 2 504 4.9
Operating leases 2 880 2 736 1 717 3 360 2 336 2 336 4 080 4 262 4 453 74.7
Property payments 5 386 6 180 5 923 5 990 7 020 7 344 6 633 6 930 7 242 (9.7)
Transport provided: Departmental activity 11 – – – – – – – –
Travel and subsistence 3 734 447 926 1 977 2 957 2 957 2 416 2 556 2 701 (18.3)
Training and development 3 271 447 1 857 3 587 3 649 3 649 4 009 4 188 4 376 9.9
Operating payments 3 804 3 838 3 115 2 470 2 528 2 533 2 970 3 103 3 243 17.3
Venues and facilities 219 1 42 116 165 165 118 127 136 (28.5)
Rental and hiring – – – – – – – – –
Interest and rent on land – – – – – – – – –
Interest – – – – – – – – –
Rent on land – – – – – – – – –
Transfers and subsidies 1 729 2 261 1 685 1 702 3 052 3 059 1 778 1 859 1 944 (41.9)
Provinces and municipalities – – – – – – – – –
Provinces – – – – – – – – –
Provincial Revenue Funds – – – – – – – – –
Provincial agencies and funds – – – – – – – – –
Municipalities – – – – – – – – –
Municipalities – – – – – – – – –
Municipal agencies and funds – – – – – – – – –
Departmental agencies and accounts 816 942 849 1 102 1 103 1 103 1 152 1 205 1 260 4.4
Social security funds – – – – – – – – –
Provide list of entities receiving transfers 816 942 849 1 102 1 103 1 103 1 152 1 205 1 260 4.4
Higher education institutions – – – – – – – – –
Foreign governments and international organisations – – – – – – – – –
Public corporations and private enterprises – – – – – – – – –
Public corporations – – – – – – – – –
Subsidies on production – – – – – – – – –
Other transfers – – – – – – – – –
Private enterprises – – – – – – – – –
Subsidies on production – – – – – – – – –
Other transfers – – – – – – – – –
Non-profit institutions – – – – – – – – –
Households 913 1 319 836 600 1 949 1 956 626 654 684 (68.0)
Social benefits 659 906 607 – 1 745 1 752 – – – (100.0)
Other transfers to households 254 413 229 600 204 204 626 654 684 206.9
Payments for capital assets 4 528 4 514 5 361 12 892 8 715 8 715 13 626 11 385 10 238 56.4
Buildings and other fixed structures – – – – – – – – –
Buildings – – – – – – – – –
Other fixed structures – – – – – – – – –
Machinery and equipment 4 492 4 514 5 361 12 892 8 715 8 715 13 626 11 385 10 238 56.4
Transport equipment 1 180 1 022 1 221 1 236 1 175 1 175 1 236 1 292 1 350 5.2
Other machinery and equipment 3 312 3 492 4 140 11 656 7 540 7 540 12 390 10 093 8 888 64.3
Heritage Assets – – – – – – – – –
Specialised military assets – – – – – – – – –
Biological assets – – – – – – – – –
Land and sub-soil assets – – – – – – – – –
Software and other intangible assets 36 – – – – – – – –
Payments for financial assets – 176 323 – – – – – –
Total economic classification 153 087 145 080 149 028 169 716 168 915 169 247 193 712 201 054 212 170 14.5
656