
Page 672 - Provincial Treasury Estimates.pdf
P. 672
Provincial Treasury
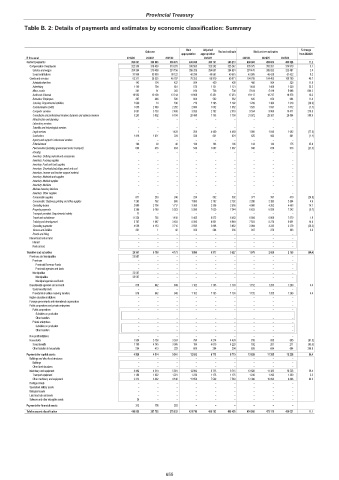
Table B. 2: Details of payments and estimates by economic classification: Summary
Main Adjusted % change
Outcome Revised estimate Medium-term estimates
appropriation appropriation from 2022/23
R thousand 2019/20 2020/21 2021/22 2022/23 2023/24 2024/25 2025/26
Current payments 385 661 356 965 366 075 406 938 395 161 395 213 439 393 459 666 483 628 11.2
Compensation of employees 322 350 318 430 319 278 336 585 325 242 325 242 335 375 355 261 374 919 3.1
Salaries and wages 284 394 279 400 281 156 296 289 284 681 284 681 291 470 308 832 323 497 2.4
Social contributions 37 956 39 030 38 122 40 296 40 561 40 561 43 905 46 429 51 422 8.2
Goods and services 63 311 38 535 46 797 70 353 69 919 69 971 104 018 104 405 108 709 48.7
Administrative fees 143 154 427 564 430 430 480 504 528 11.6
Advertising 1 109 794 651 576 1 121 1 121 1 404 1 469 1 539 25.2
Minor assets 301 81 263 814 736 736 5 184 5 419 5 666 604.3
Audit cost: External 16 952 10 100 13 314 11 968 17 351 17 351 19 117 18 737 19 578 10.2
Bursaries: Employees 397 446 530 600 562 562 626 654 684 11.4
Catering: Departmental activities 1 980 14 190 718 1 795 1 792 1 239 1 304 1 370 (30.9)
Communication (G&S) 1 639 2 569 2 282 2 684 1 552 1 552 1 525 1 597 1 672 (1.7)
Computer services 3 001 3 703 2 408 3 926 2 782 2 510 9 534 9 960 10 411 279.8
Consultants and professional services: Business and advisory services 3 203 3 802 6 784 20 498 7 755 7 750 31 072 29 307 29 884 300.9
Infrastructure and planning – – – – – – – – –
Laboratory services – – – – – – – – –
Scientific and technological services – – – – – – – – –
Legal services 1 – 1 429 250 4 469 4 469 1 000 1 045 1 092 (77.6)
Contractors 1 416 1 071 229 530 531 531 525 553 581 (1.1)
Agency and support / outsourced services – – – – – – – – –
Entertainment 106 29 40 134 103 106 144 144 175 35.8
Fleet services (including government motor transport) 684 435 464 540 1 067 1 067 840 878 918 (21.3)
Housing – – – – – – – – –
Inventory: Clothing material and accessories – – – – – – – – –
Inventory: Farming supplies – – – – – – – – –
Inventory: Food and food supplies – – – – – – – – –
Inventory: Chemicals,fuel,oil,gas,wood and coal – – – – – – – – –
Inventory: Learner and teacher support material – – – – – – – – –
Inventory: Materials and supplies – – – – – – – – –
Inventory: Medical supplies – – – – – – – – –
Inventory: Medicine – – – – – – – – –
Medsas inventory interface – – – – – – – – –
Inventory: Other supplies – – – – – – – – –
Consumable supplies 871 263 246 230 502 502 377 397 419 (24.9)
Consumable: Stationery,printing and office supplies 1 293 162 695 1 995 2 182 2 182 2 290 2 395 2 504 4.9
Operating leases 2 880 2 736 1 717 3 360 2 336 2 336 4 080 4 262 4 453 74.7
Property payments 5 386 6 180 5 923 5 990 7 020 7 344 6 633 6 930 7 242 (9.7)
Transport provided: Departmental activity 11 – – – – – – – –
Travel and subsistence 11 234 755 1 815 5 463 6 572 6 463 6 584 6 969 7 570 1.9
Training and development 5 787 1 087 3 633 6 595 6 951 6 949 7 923 8 278 8 651 14.0
Operating payments 4 556 4 153 3 715 2 595 3 808 3 882 3 094 3 233 3 379 (20.3)
Venues and facilities 361 1 42 323 294 336 347 370 393 3.3
Rental and hiring – – – – – – – – –
Interest and rent on land – – – – – – – – –
Interest – – – – – – – – –
Rent on land – – – – – – – – –
Transfers and subsidies 26 357 6 100 4 173 1 886 5 317 5 527 1 970 2 060 2 155 (64.4)
Provinces and municipalities 23 587 – – – – – – – –
Provinces – – – – – – – – –
Provincial Revenue Funds – – – – – – – – –
Provincial agencies and funds – – – – – – – – –
Municipalities 23 587 – – – – – – – –
Municipalities 23 587 – – – – – – – –
Municipal agencies and funds – – – – – – – – –
Departmental agencies and accounts 816 942 849 1 102 1 103 1 103 1 152 1 205 1 260 4.4
Social security funds – – – – – – – – –
Provide list of entities receiving transfers 816 942 849 1 102 1 103 1 103 1 152 1 205 1 260 4.4
Higher education institutions – – – – – – – – –
Foreign governments and international organisations – – – – – – – – –
Public corporations and private enterprises – – – – – – – – –
Public corporations – – – – – – – – –
Subsidies on production – – – – – – – – –
Other transfers – – – – – – – – –
Private enterprises – – – – – – – – –
Subsidies on production – – – – – – – – –
Other transfers – – – – – – – – –
Non-profit institutions – – – – – – – – –
Households 1 954 5 158 3 324 784 4 214 4 424 818 855 895 (81.5)
Social benefits 1 700 4 745 3 095 184 4 010 4 220 192 201 211 (95.5)
Other transfers to households 254 413 229 600 204 204 626 654 684 206.9
Payments for capital assets 4 528 4 514 5 361 12 892 8 715 8 715 13 626 11 385 10 238 56.4
Buildings and other fixed structures – – – – – – – – –
Buildings – – – – – – – – –
Other fixed structures – – – – – – – – –
Machinery and equipment 4 492 4 514 5 361 12 892 8 715 8 715 13 626 11 385 10 238 56.4
Transport equipment 1 180 1 022 1 221 1 236 1 175 1 175 1 236 1 292 1 350 5.2
Other machinery and equipment 3 312 3 492 4 140 11 656 7 540 7 540 12 390 10 093 8 888 64.3
Heritage Assets – – – – – – – – –
Specialised military assets – – – – – – – – –
Biological assets – – – – – – – – –
Land and sub-soil assets – – – – – – – – –
Software and other intangible assets 36 – – – – – – – –
Payments for financial assets 313 176 323 – – – – – –
Total economic classification 416 859 367 755 375 932 421 716 409 193 409 455 454 989 473 111 496 021 11.1
655