Page 689 - Provincial Treasury Estimates.pdf
P. 689

Estimates of the Provincial Revenue and Expenditure (EPRE) – 2023/24 Financial Year

           7.2 Programme summary


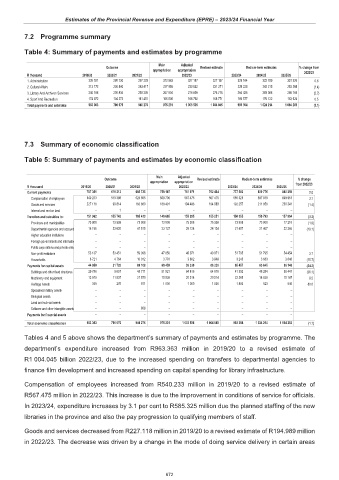
           Table 4: Summary of payments and estimates by programme

                                                          Main    Adjusted
                                        Outcome                          Revised estimate  Medium-term estimates  % change from
                                                        appropriation  appropriation                          2022/23
            R thousand          2019/20  2020/21  2021/22          2022/23          2023/24  2024/25  2025/26
            1. Administration                  335 021                 290 730                 297 203                 312 963                 327 187                 327 187                 329 164                 322 789                 331 326  0.6
            2. Cultural Affairs                  213 172                 200 840                 243 417                 227 958                 230 832                 231 371                 228 228                 242 215                 253 268  (1.4)
            3. Library And Archives Services                  240 198                 200 834                 238 205                 267 804                 276 695                 276 716                 266 425                 283 088                 295 765  (3.7)
            4. Sport And Recreation                  174 972                 104 272                 161 451                 166 506                 168 792                 168 771                 169 577                 176 122                 183 924  0.5
            Total payments and estimates                  963 363                 796 676                 940 276                 975 231              1 003 506              1 004 045                 993 394              1 024 214              1 064 283  (1.1)


           7.3  Summary of economic classification

           Table 5: Summary of payments and estimates by economic classification


                                                          Main   Adjusted
                                       Outcome                          Revised estimate  Medium-term estimates  % change
                                                       appropriation  appropriation
            R thousand         2019/20  2020/21  2021/22          2022/23          2023/24  2024/25  2025/26  from 2022/23
            Current payments                  767 351                  619 213                  685 735                  758 107                  761 971                  762 464                  777 582                  809 776                  840 259  2.0
              Compensation of employees                   540 233                  519 398                  524 855                  569 706                  567 475                  567 475                  585 325                  597 918                  609 918  3.1
              Goods and services                   227 118                    99 814                  160 880                  188 401                  194 496                  194 989                  192 257                  211 858                  230 341  (1.4)
              Interest and rent on land                              –                             1                             –                             –                             –                             –                             –                             –                             –
            Transfers and subsidies to:                  151 962                  155 743                  185 433                  148 665                  155 205                  155 251                  150 355                  150 793                  157 884  (3.2)
              Provinces and municipalities                     73 908                    73 908                    73 908                    73 908                    75 308                    75 308                    73 908                    73 908                    77 216  (1.9)
              Departmental agencies and accounts                   16 196                    23 620                    41 515                    23 137                    26 124                    26 124                    21 407                    21 407                    22 366  (18.1)
              Higher education institutions                             –                             –                             –                             –                             –                             –                             –                             –                             –
              Foreign governments and internation                            –                             –                             –                             –                             –                             –                             –                             –                             –
              Public corporations and private ente                            –                             –                             –                             –                             –                             –                             –                             –                             –
              Non-profit institutions                    53 137                    53 451                    59 998                    47 850                    49 971                    49 971                    51 795                    51 795                    54 454  3.7
              Households                         8 721                      4 764                    10 012                      3 770                      3 802                      3 848                      3 245                      3 683                      3 848  (15.7)
            Payments for capital assets                    44 050                    21 720                    69 108                    68 459                    86 330                    86 330                    65 457                    63 645                    66 140  (24.2)
              Buildings and other fixed structures                   29 786                      9 607                    45 711                    51 921                    64 816                    64 816                    41 392                    48 284                    50 447  (36.1)
              Machinery and equipment                    13 919                    11 837                    21 570                    15 538                    20 514                    20 514                    22 265                    14 838                    15 147  8.5

              Heritage Assets                         345                         276                         971                      1 000                      1 000                      1 000                      1 800                        523                         546  80.0
              Specialised military assets                             –                             –                             –                             –                             –                             –                             –                             –                             –
              Biological assets                             –                             –                             –                             –                             –                             –                             –                             –                             –
              Land and sub-soil assets                             –                             –                             –                             –                             –                             –                             –                             –                             –
              Software and other intangible assets                            –                             –                         856                             –                             –                             –                             –                             –                             –
            Payments for financial assets                             –                             –                             –                             –                             –                             –                             –                             –                             –
            Total economic classification                  963 363                  796 676                  940 276                  975 231               1 003 506               1 004 045                  993 394               1 024 214               1 064 283  (1.1)

           Tables 4 and 5 above shows the department’s summary of payments and estimates by programme. The

           department’s expenditure increased  from R963.363  million in 2019/20 to a  revised estimate of
           R1 004.045 billion 2022/23, due  to the increased spending on  transfers to departmental agencies  to
           finance film development and increased spending on capital spending for library infrastructure.

           Compensation of employees increased  from R540.233  million in 2019/20  to a revised estimate of

           R567.475 million in 2022/23. This increase is due to the improvement in conditions of service for officials.
           In 2023/24, expenditure increases by 3.1 per cent to R585.325 million due the planned staffing of the new

           libraries in the province and also the pay progression to qualifying members of staff.

           Goods and services decreased from R227.118 million in 2019/20 to a revised estimate of R194.989 million
           in 2022/23. The decrease was driven by a change in the mode of doing service delivery in certain areas


                                                             672
   684   685   686   687   688   689   690   691   692   693   694