
Page 691 - Provincial Treasury Estimates.pdf
P. 691
Estimates of the Provincial Revenue and Expenditure (EPRE) – 2023/24 Financial Year
7.4 Expenditure by municipal boundary
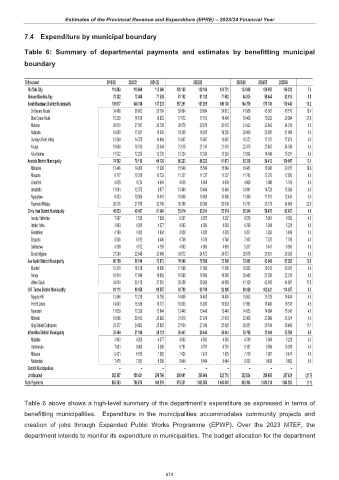
Table 6: Summary of departmental payments and estimates by benefitting municipal
boundary
R thousand 2019/20 2020/21 2021/22 2022/23 2023/24 2024/25 2025/26
Buffalo City 110 843 110 604 113 346 128 180 128 180 124 721 133 948 139 962 146 232 7.4
Nelson Mandela Bay 70 202 72 484 77 538 81 182 81 182 77 982 84 835 88 644 92 615 8.8
Sarah Baartman District Municipality 136 017 144 314 147 231 157 291 157 291 149 100 164 370 171 749 179 443 10.2
Dr Beyers Naude 34 498 36 602 35 104 39 894 39 894 34 912 41 689 43 561 45 513 19.4
Blue Crane Route 15 230 16 159 16 822 17 613 17 613 14 404 18 406 19 232 20 094 27.8
Makana 26 010 27 597 28 728 30 078 30 078 30 078 31 432 32 843 34 314 4.5
Ndlambe 16 608 17 621 18 343 19 205 19 205 19 205 20 069 20 970 21 909 4.5
Sundays River Valley 13 549 14 375 14 964 15 667 15 667 15 667 16 372 17 107 17 873 4.5
Kouga 18 600 19 735 20 544 21 510 21 510 21 510 22 478 23 487 24 539 4.5
Kou-Kamma 11 522 12 225 12 726 13 324 13 324 13 324 13 924 14 549 15 201 4.5
Amatole District Municipality 74 562 79 110 69 126 86 223 86 223 81 873 92 338 96 412 100 647 12.8
Mbhashe 13 446 14 266 11 399 15 549 15 549 15 549 18 483 19 240 20 017 18.9
Mnquma 9 717 10 310 10 733 11 237 11 237 11 237 11 743 12 270 12 820 4.5
Great Kei 4 029 4 275 4 450 4 659 4 659 4 659 4 869 5 088 5 316 4.5
Amahlathi 11 661 12 372 8 977 13 484 13 484 13 484 14 091 14 724 15 384 4.5
Ngqushwa 9 433 10 008 10 418 10 908 10 908 10 908 11 399 11 911 12 445 4.5
Raymond Mhlaba 26 276 27 879 23 149 30 386 30 386 26 036 31 753 33 179 34 665 22.0
Chris Hani District Municipality 46 623 49 467 51 494 53 914 53 914 53 914 56 340 58 870 62 407 4.5
Inxuba Yethemba 7 097 7 530 7 839 8 207 8 207 8 207 8 576 8 961 9 362 4.5
Intsika Yethu 3 963 4 205 4 377 4 583 4 583 4 583 4 789 5 004 5 228 4.5
Emalahleni 4 169 4 423 4 604 4 820 4 820 4 820 5 037 5 263 5 499 4.5
Engcobo 5 836 6 192 6 446 6 749 6 749 6 749 7 053 7 370 7 700 4.5
Sakhisizwe 4 309 4 572 4 759 4 983 4 983 4 983 5 207 5 441 6 585 4.5
Enoch Mgijima 21 249 22 545 23 469 24 572 24 572 24 572 25 678 26 831 28 033 4.5
Joe Gqabi District Municipality 66 158 69 194 73 073 76 508 76 508 72 109 79 951 83 549 87 292 10.9
Elundini 15 210 16 138 16 800 17 590 17 590 17 590 18 382 19 215 20 076 4.5
Senqu 16 914 17 946 18 682 19 560 19 560 19 560 20 440 21 358 22 315 4.5
Walter Sisulu 34 034 35 110 37 591 39 358 39 358 34 959 41 129 42 976 44 901 17.6
O.R. Tambo District Municipality 81 111 86 058 89 587 93 799 93 799 92 185 98 020 102 421 114 637 6.3
Ngquza Hill 12 456 13 216 13 758 14 405 14 405 14 405 15 053 15 729 16 434 4.5
Port St Johns 14 643 15 536 16 173 16 933 16 933 16 933 17 695 18 490 19 318 4.5
Nyandeni 11 629 12 338 12 844 13 448 13 448 13 448 14 053 14 684 15 342 4.5
Mhlontlo 19 006 20 165 20 992 21 979 21 979 21 979 22 968 23 999 25 074 4.5
King Sabata Dalindyebo 23 377 24 803 25 820 27 034 27 034 25 420 28 251 29 519 38 469 11.1
Alfred Nzo District Municipality 25 460 27 014 28 121 29 443 29 443 29 443 30 768 31 949 33 589 4.5
Matatiele 3 963 4 205 4 377 4 583 4 583 4 583 4 789 5 004 5 228 4.5
Umzimvubu 7 601 8 065 8 396 8 791 8 791 8 791 9 187 9 599 10 029 4.5
Mbizana 6 421 6 813 7 092 7 425 7 425 7 425 7 759 7 907 8 470 4.5
Ntabankulu 7 475 7 931 8 256 8 644 8 644 8 644 9 033 9 439 9 862 4.5
District Municipalities – – – – – – – – –
Unallocated 352 387 158 431 290 760 268 691 296 966 322 718 252 824 250 658 247 421 (21.7)
Total Payments 963 363 796 676 940 276 975 231 1 003 506 1 004 045 993 394 1 024 214 1 064 283 (1.1)
Table 6 above shows a high-level summary of the department’s expenditure as expressed in terms of
benefitting municipalities. Expenditure in the municipalities accommodates community projects and
creation of jobs through Expanded Public Works Programme (EPWP). Over the 2023 MTEF, the
department intends to monitor its expenditure in municipalities. The budget allocation for the department
674